Credit Risk Prediction.
A calibrated LightGBM credit scoring and default detection pipeline, optimized for cost-sensitive risk thresholds and equipped with model interpretability using SHAP values.

Credit Underwriting Challenges & Cost Asymmetry
In retail banking and digital lending, estimating an applicant's Probability of Default (PD) is a pillar of regulatory compliance and capital management. Prediction errors carry drastic cost asymmetry: approving a borrower who defaults causes severe principal loan losses that vastly outweigh the missed interest revenue of rejecting a creditworthy applicant.
Furthermore, modern financial regulations mandate that credit rejections can be explained transparently to applicants and regulatory auditors through Explainable AI (XAI).
Financial Underwriting Pipeline Architecture
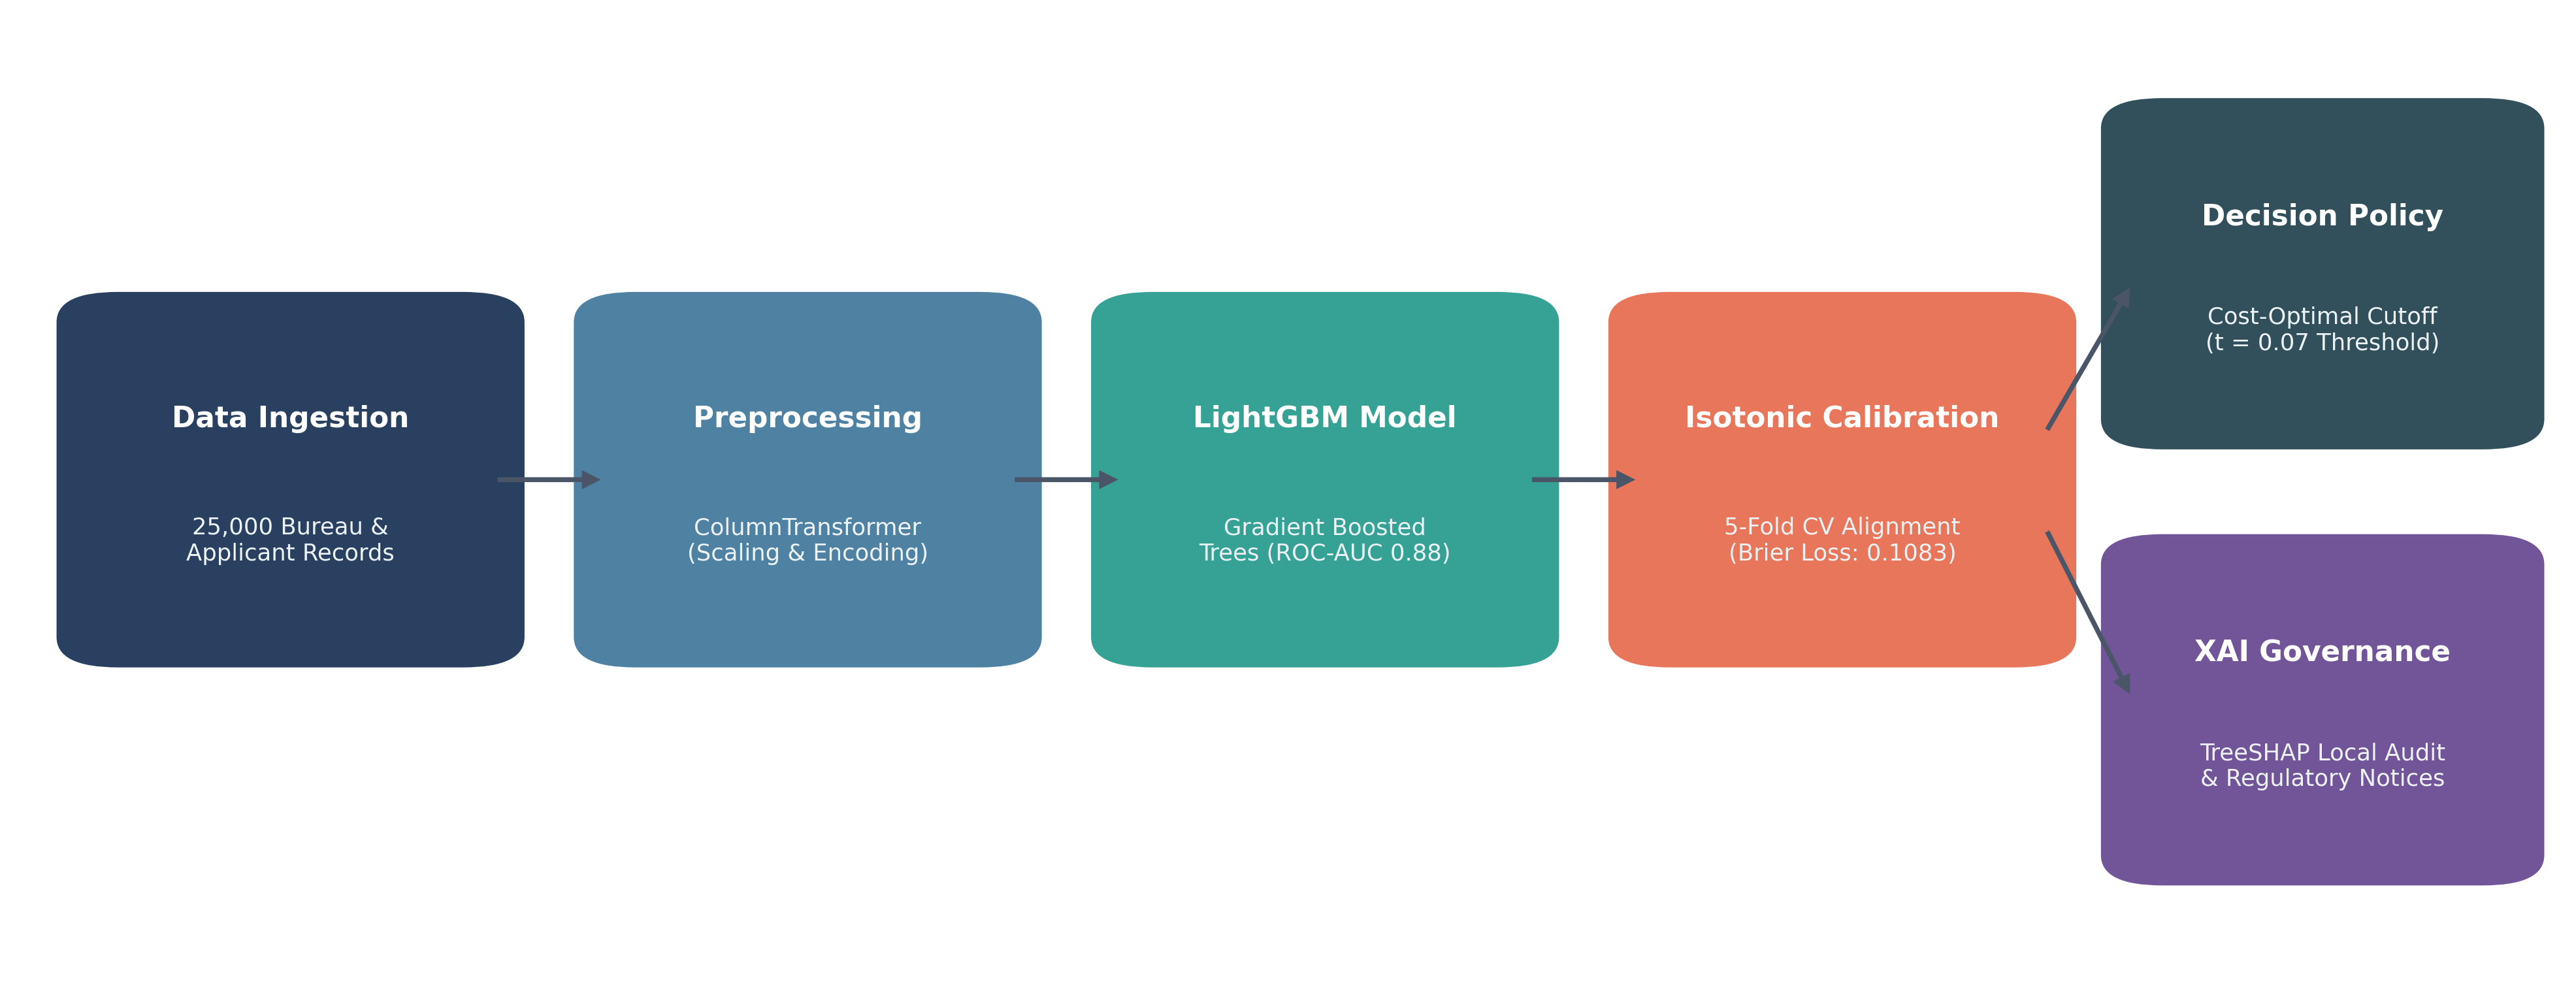
This project designs a comprehensive pipeline integrating gradient-boosted decision trees, empirical probability calibration, cost-sensitive threshold optimization, and SHAP explainability modules:
Probability Calibration for Credit Default
Standard classification models often yield strong ranking performance (high ROC-AUC), yet raw output scores can diverge significantly from true empirical default frequencies. This pipeline applies Isotonic Regression calibration so model score outputs directly reflect actual default rates:
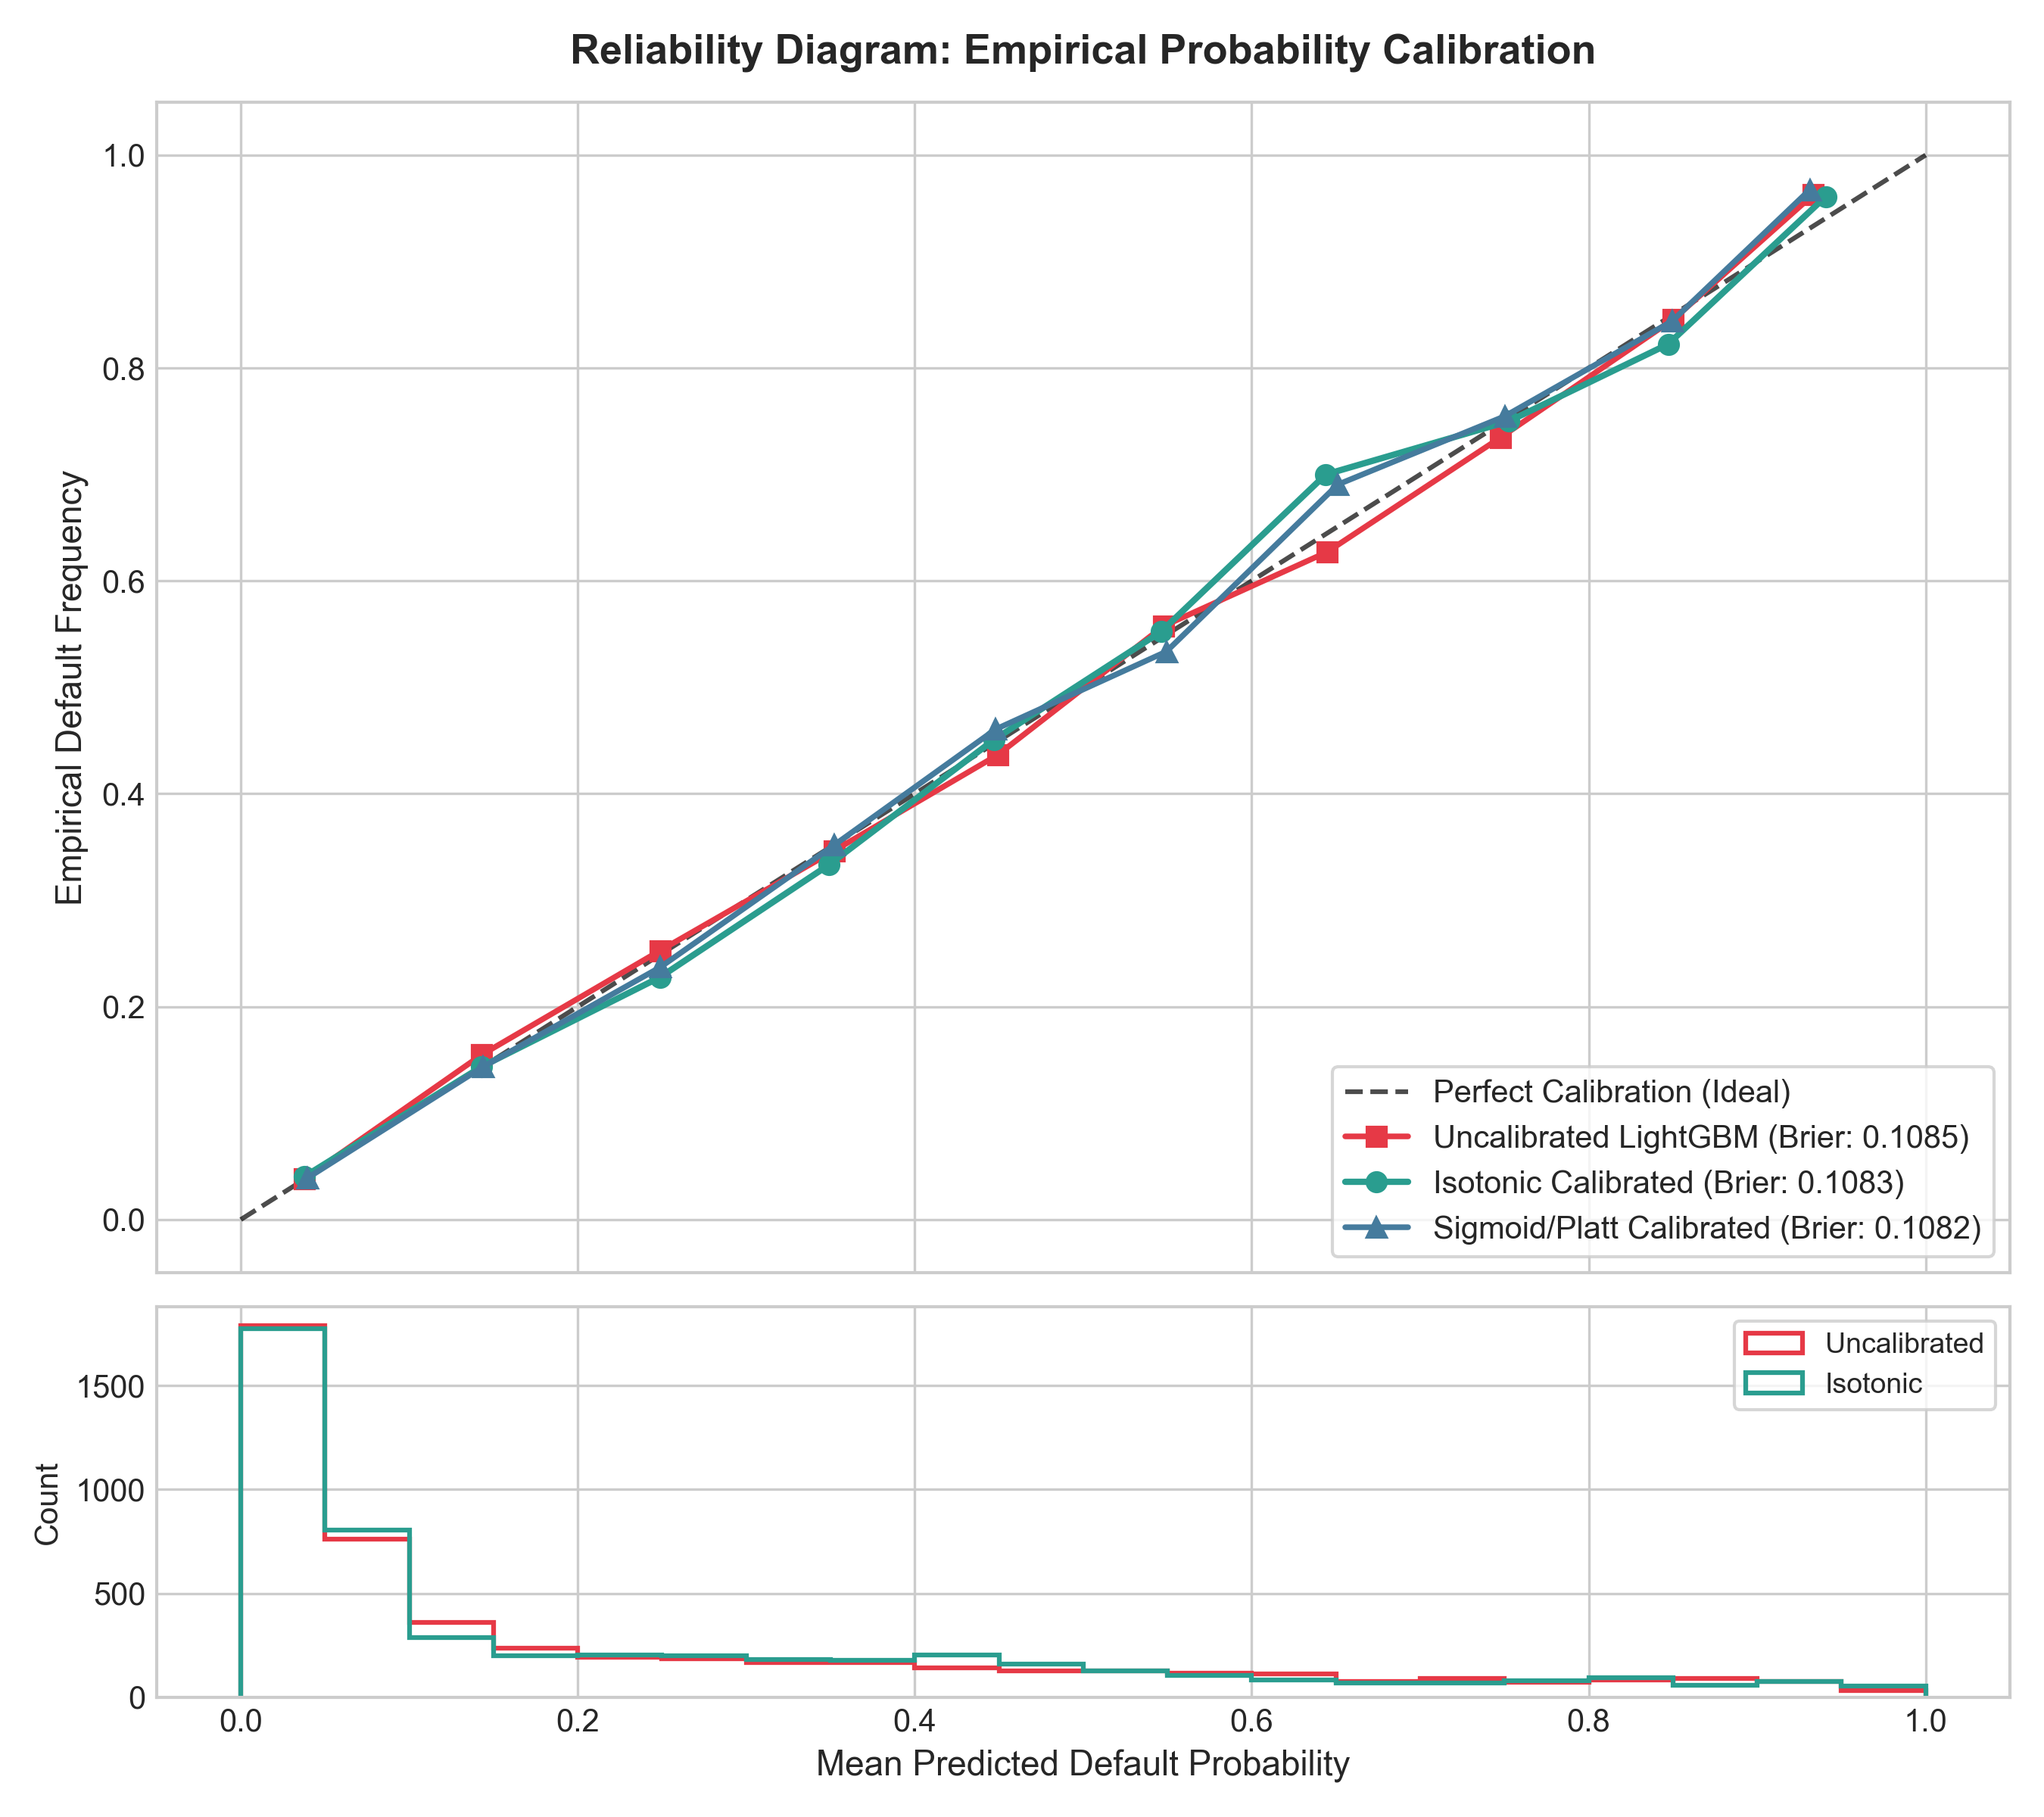
The calibration curve demonstrates that an applicant with a predicted score of 0.2 exhibits an empirical default rate of precisely 20%, satisfying Basel II and III risk modeling requirements.
Cost-Sensitive Threshold Optimization
The standard 0.5 classification cutoff is replaced with cost-sensitive threshold optimization based on expected portfolio loss:
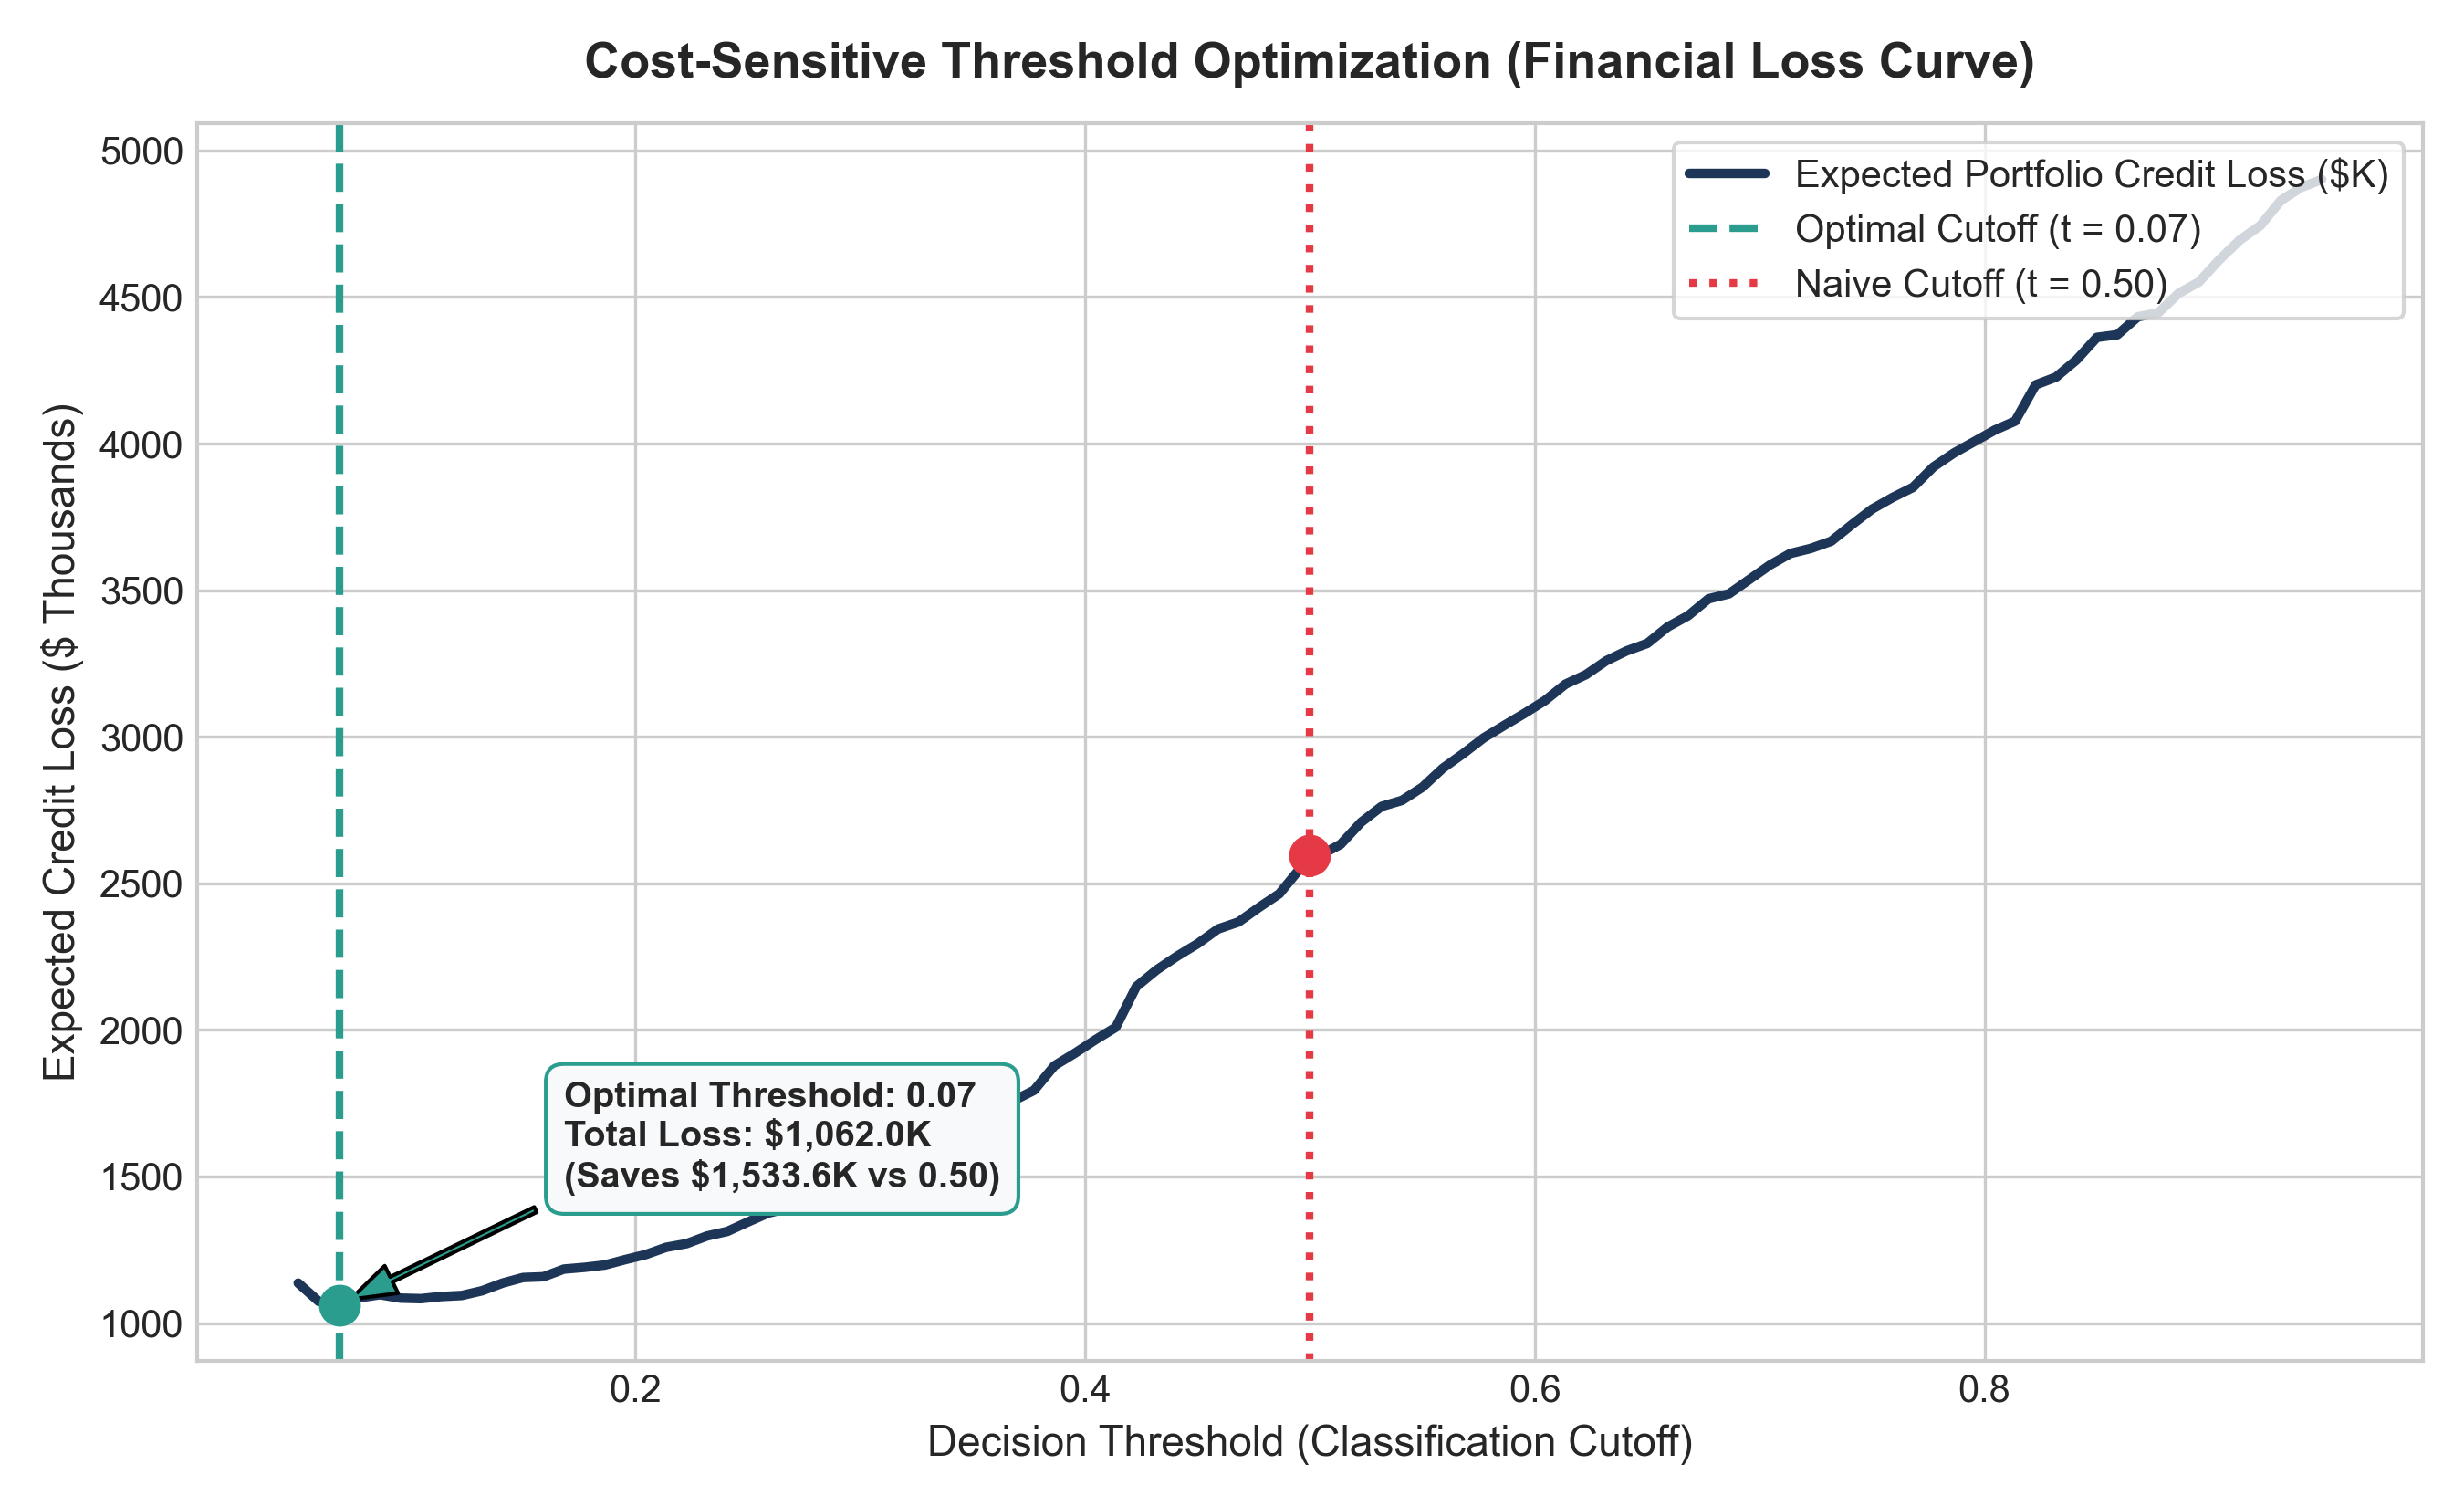
By accounting for the loss severity of default relative to interest earnings, the optimal threshold shifts to minimize the total Expected Loss across the entire loan portfolio.
Decision Transparency with SHAP Values (Global & Local)
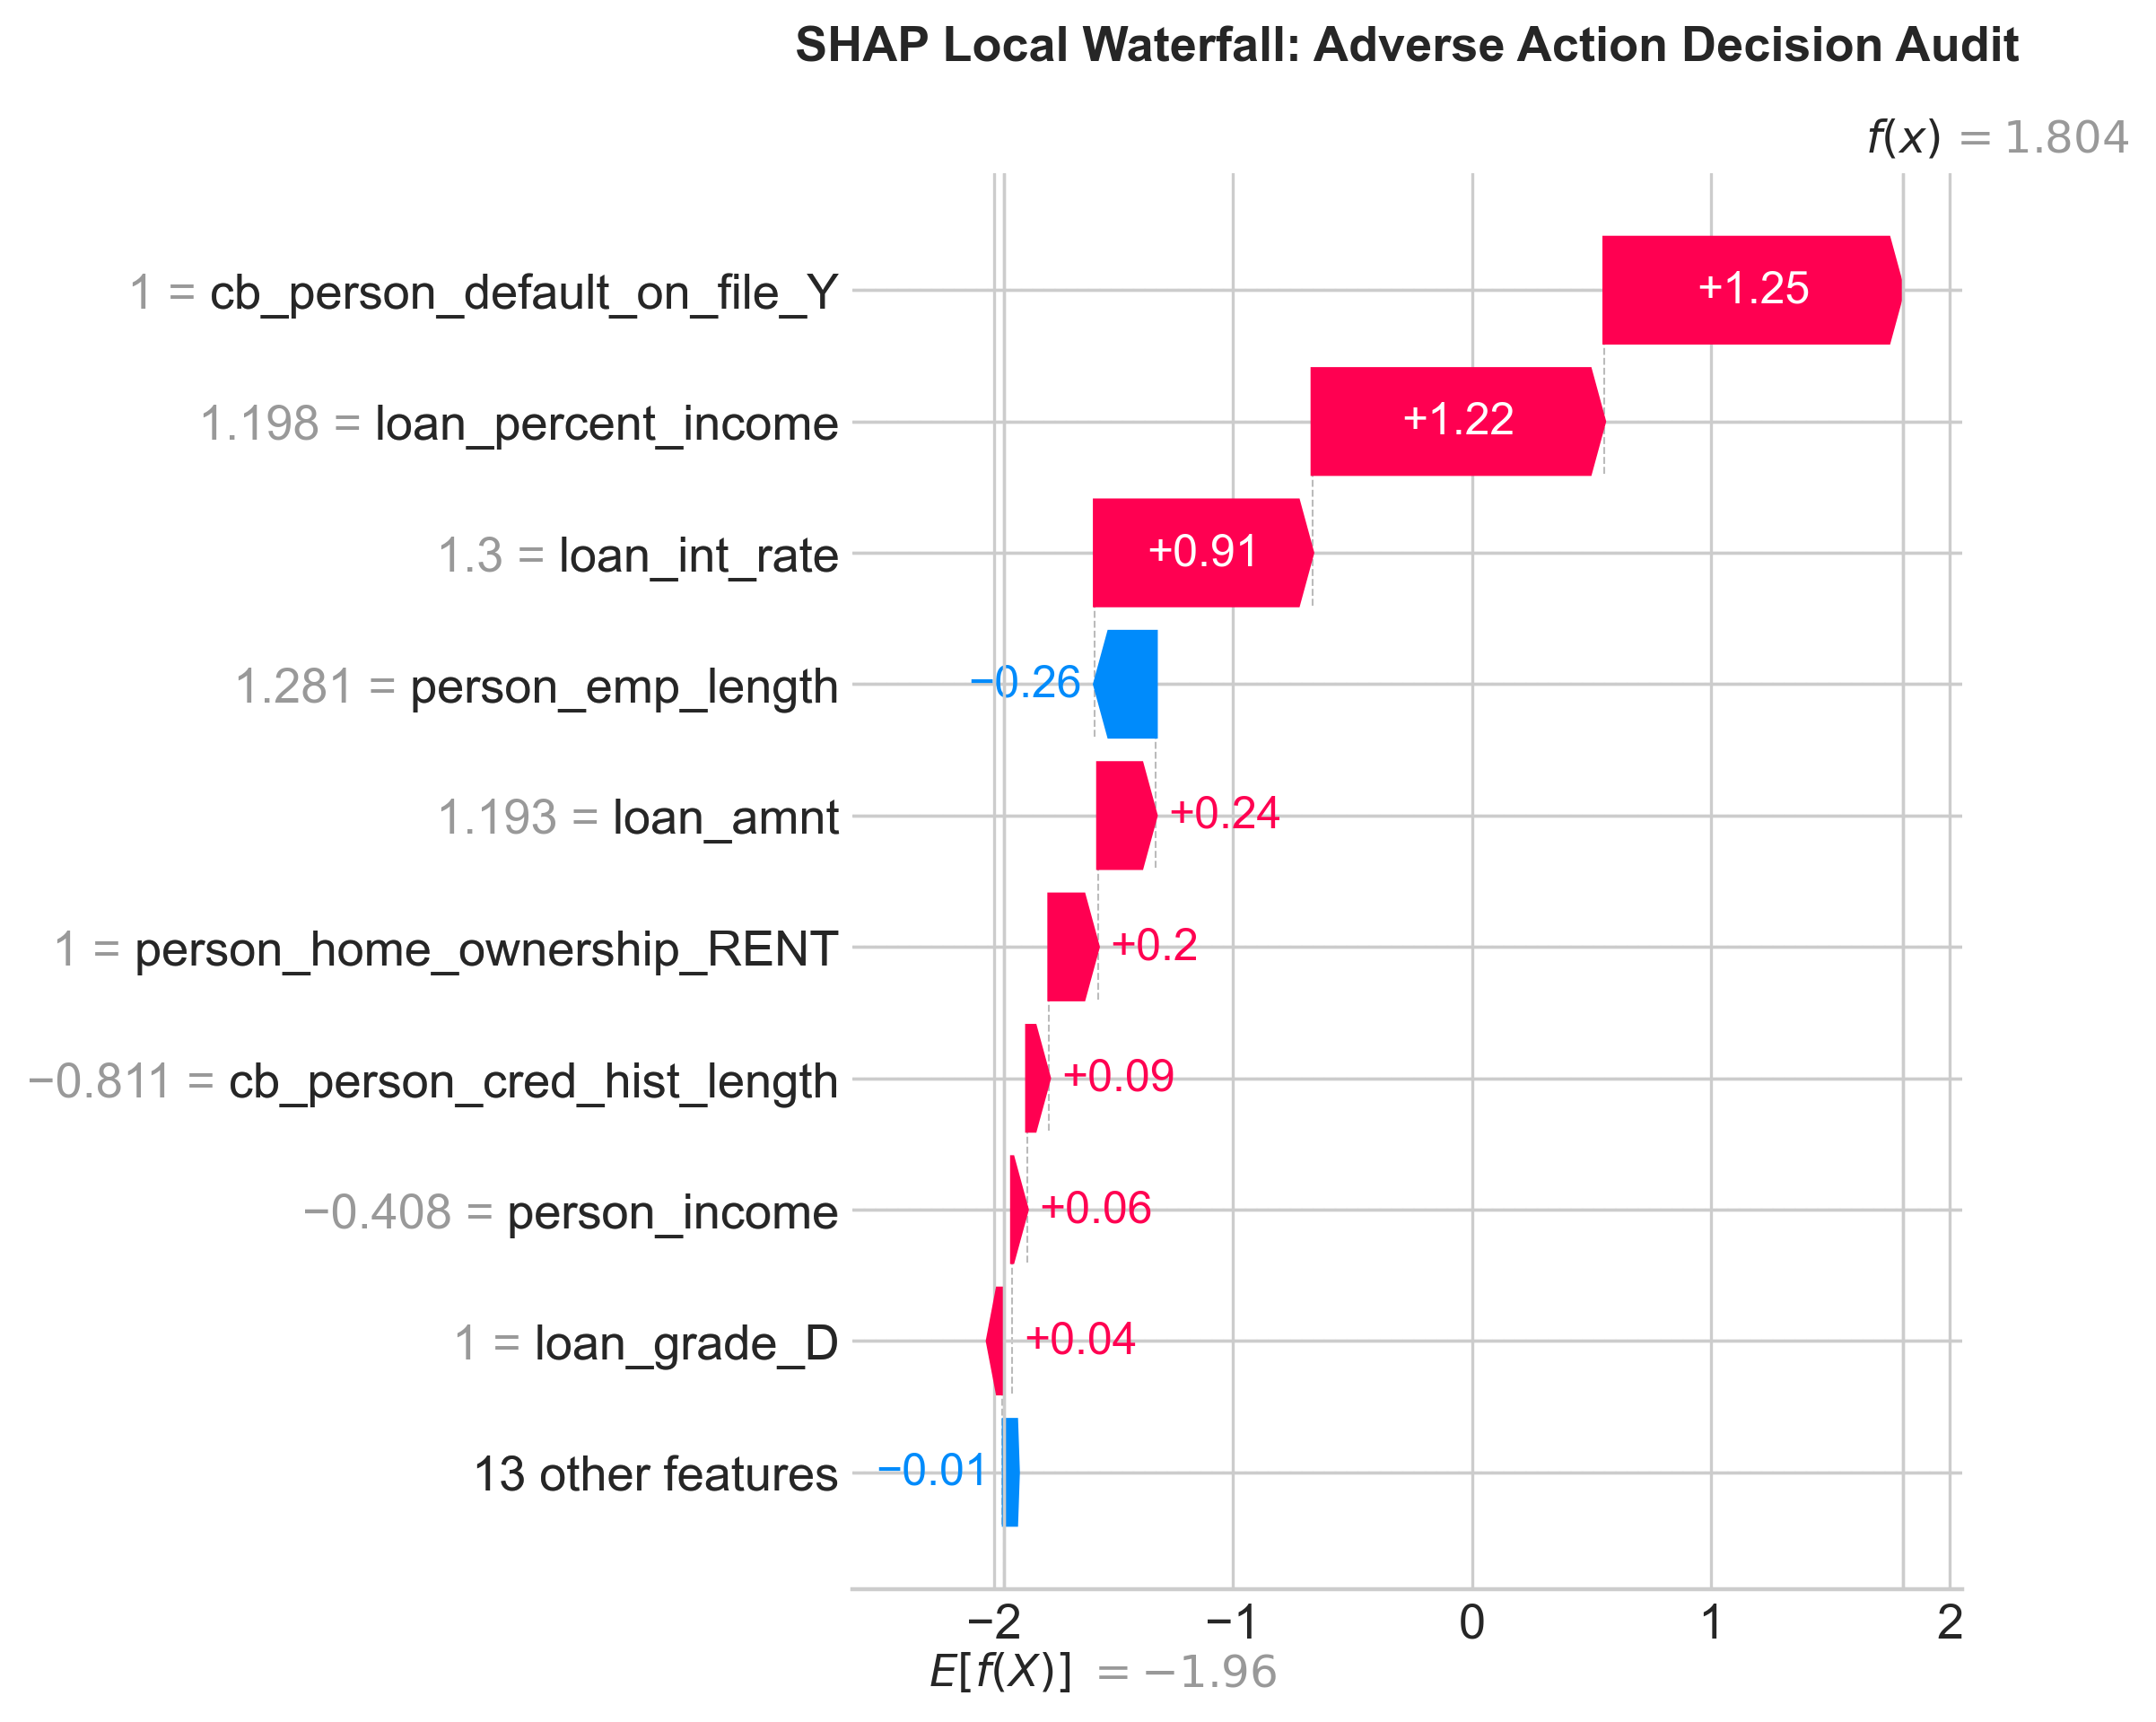
Regulatory compliance audits and decision transparency are fulfilled through the SHAP (SHapley Additive exPlanations) framework:
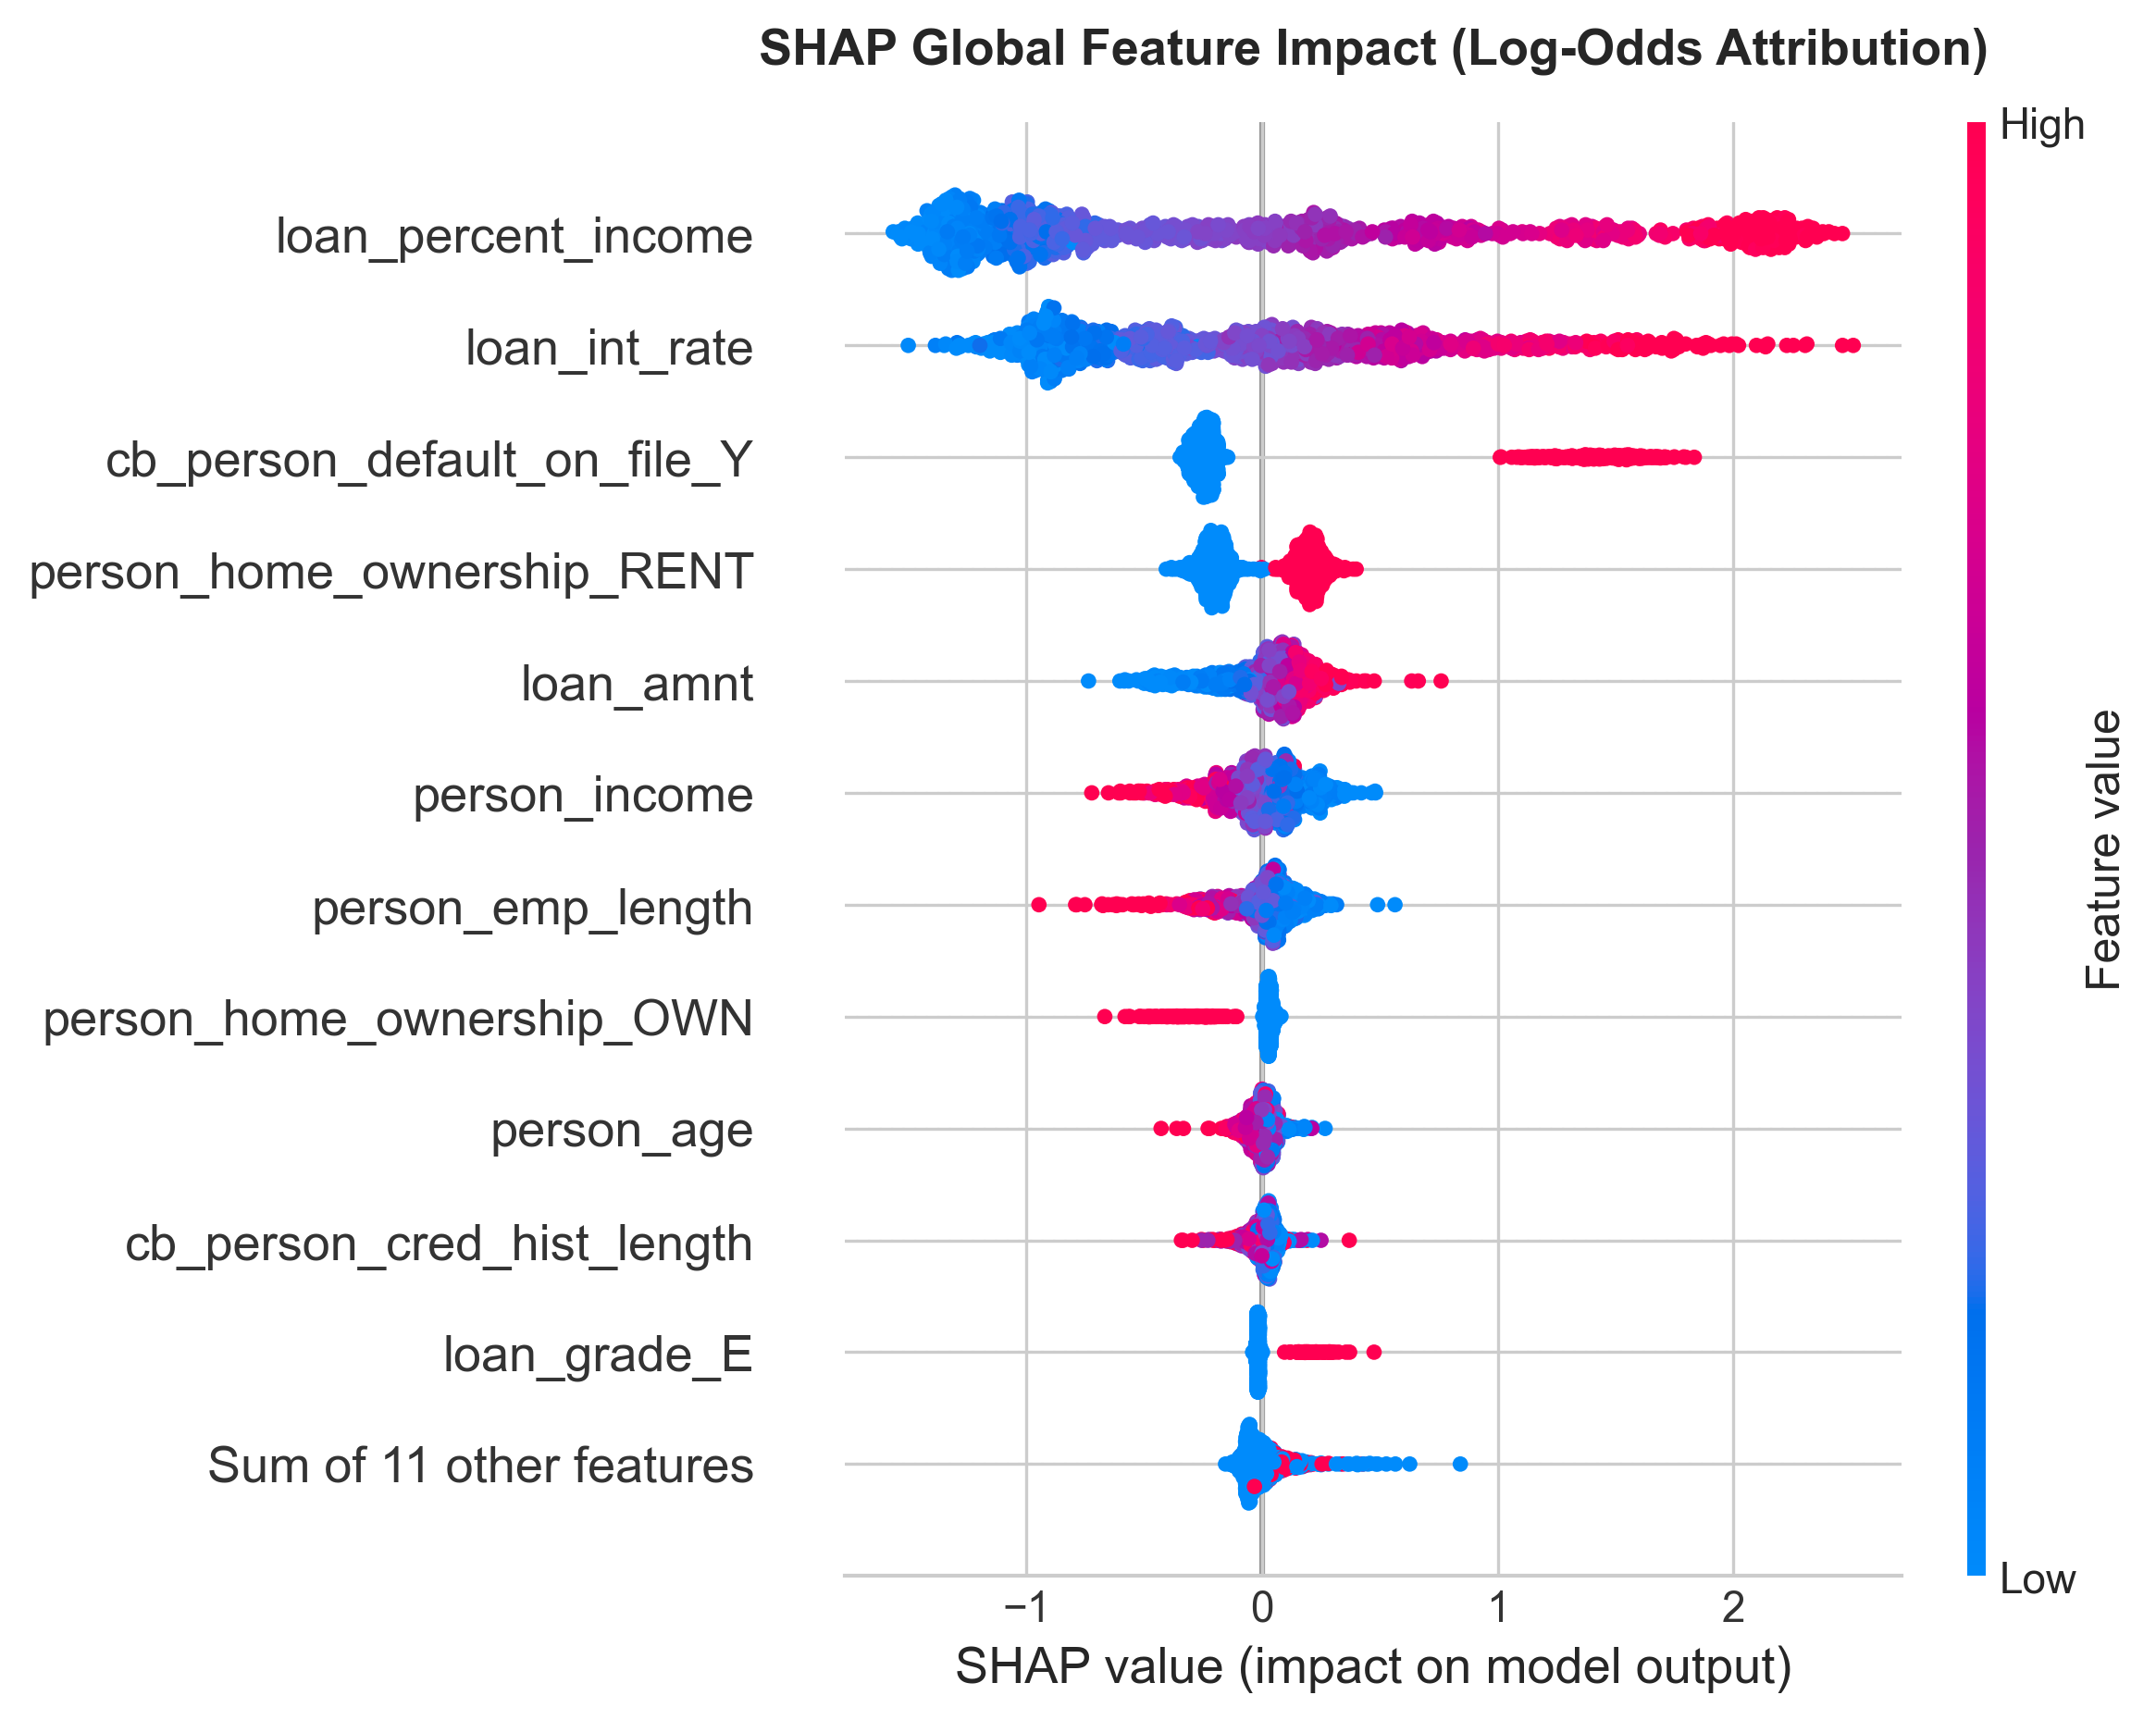
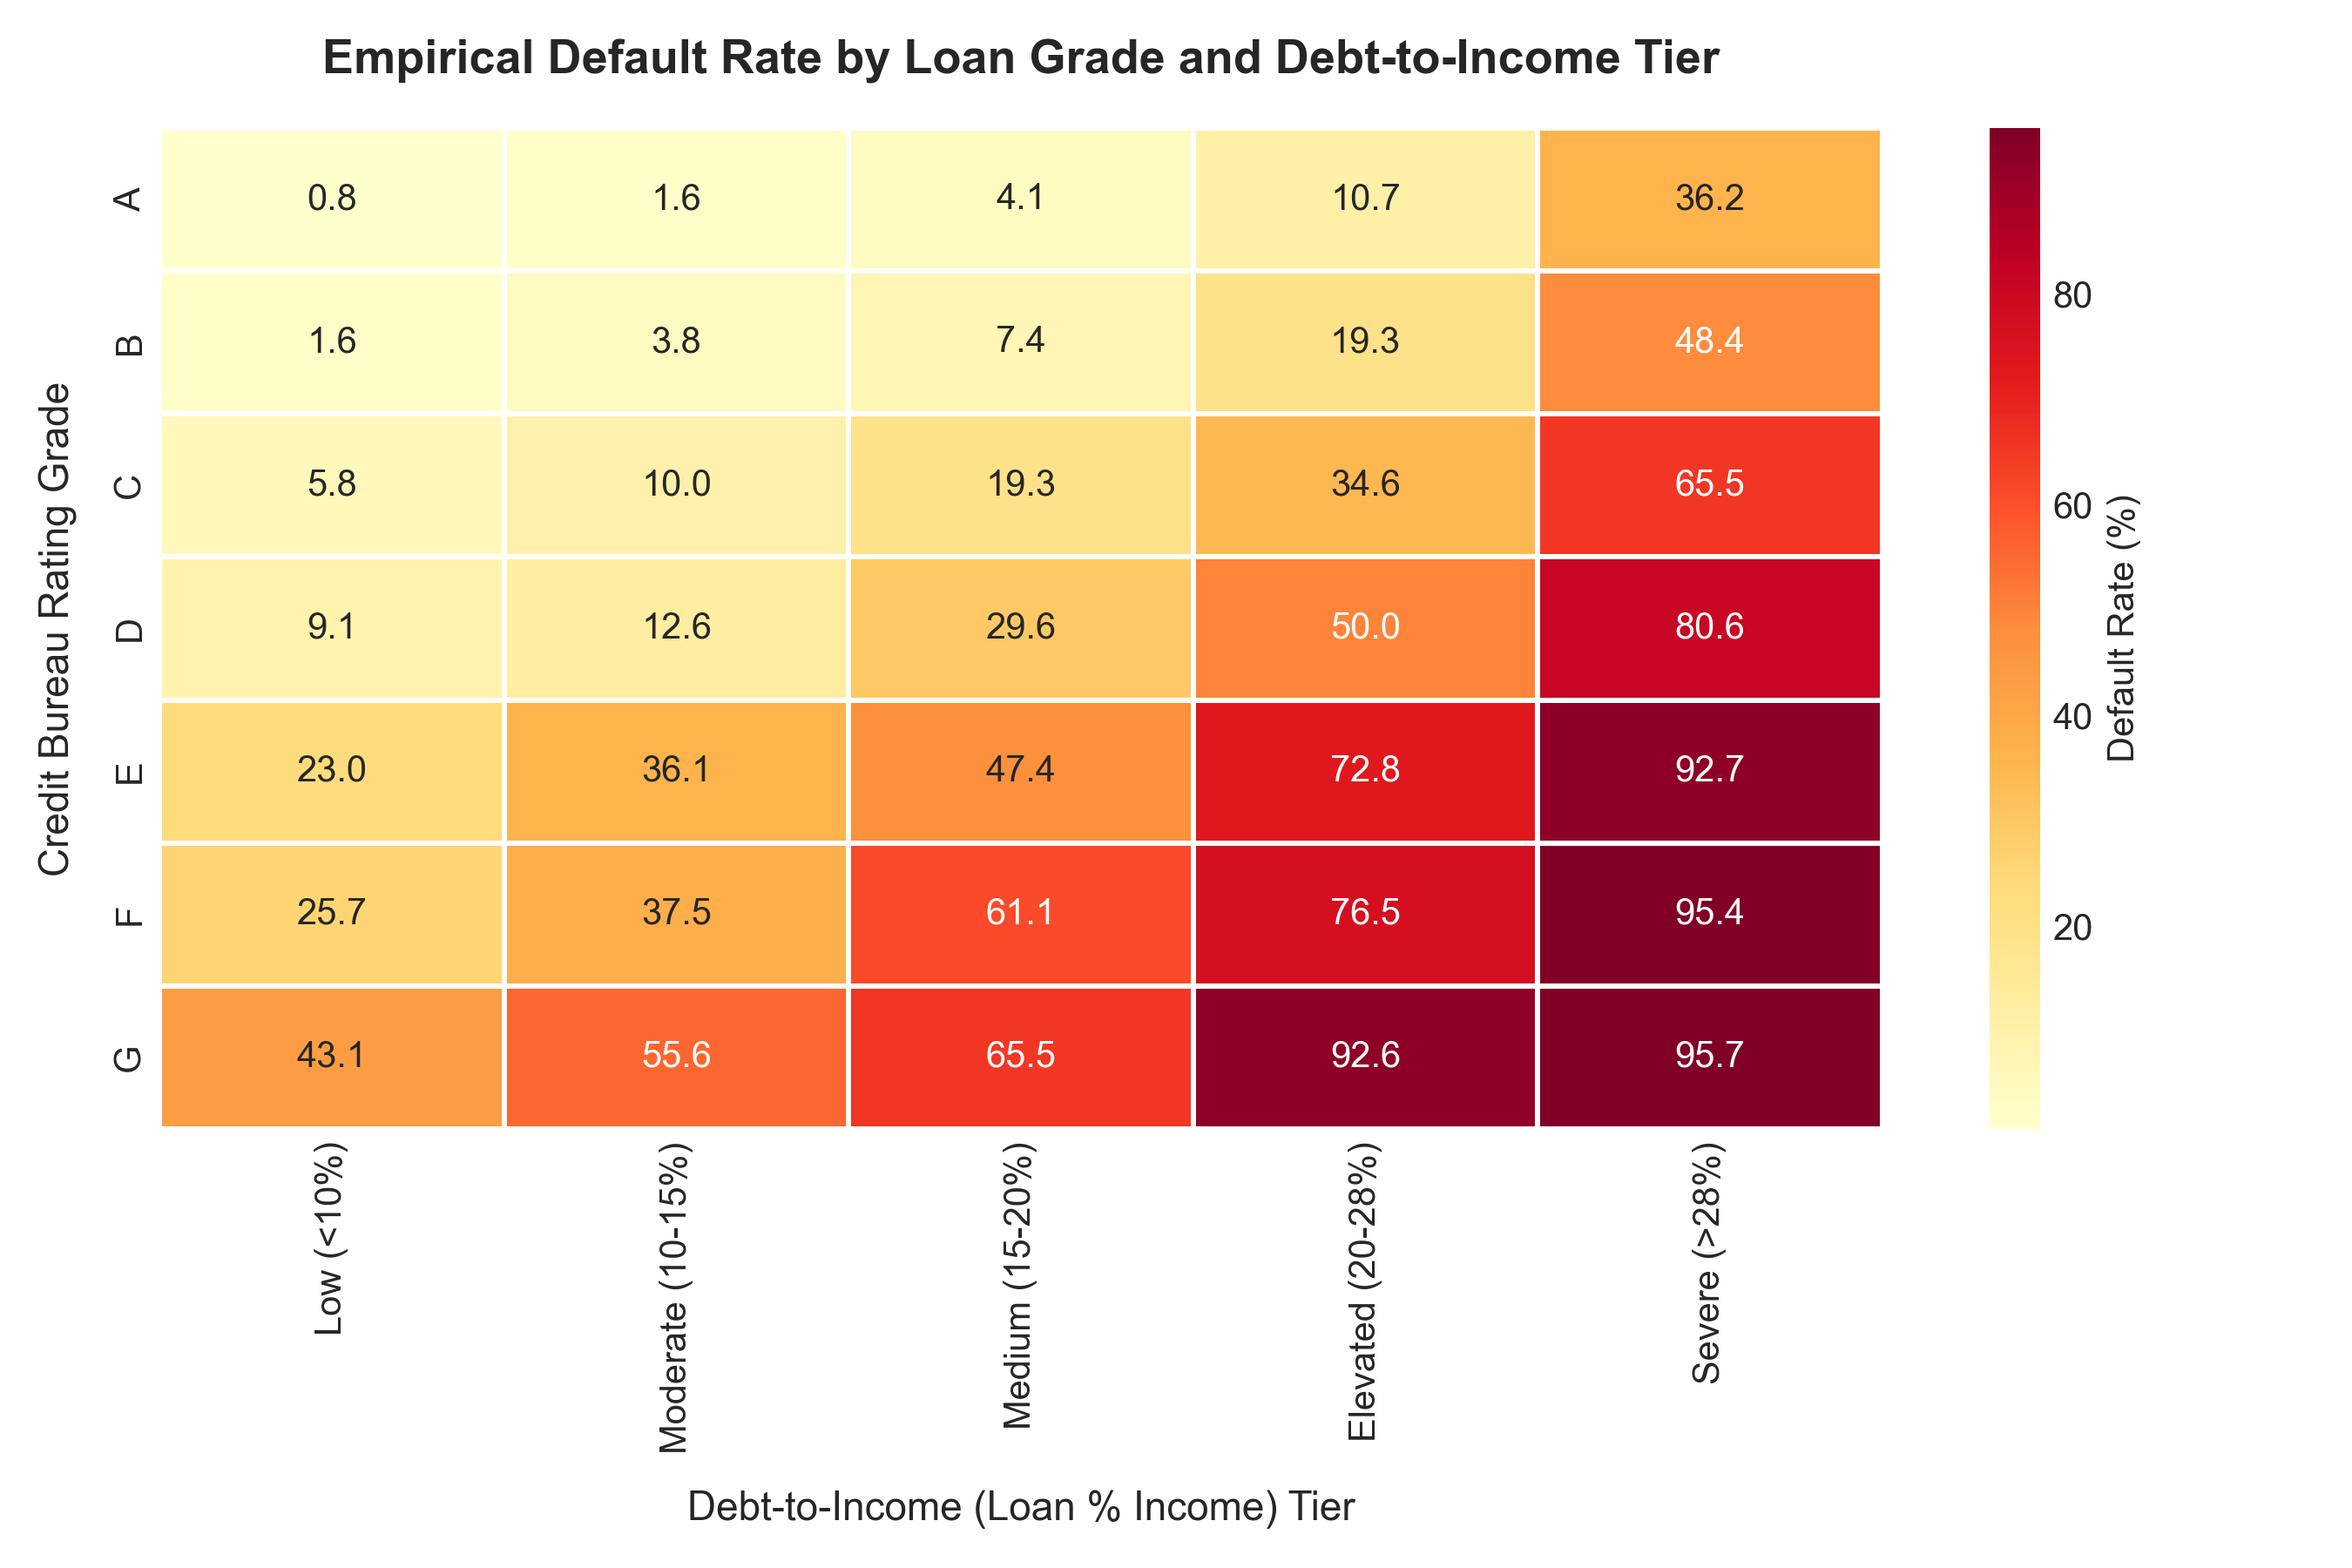
- Global Interpretability (Beeswarm): Identifies revolving line utilization, 90-day past-due history, and debt-to-income ratio as the primary systemic risk drivers across the portfolio.
- Local Explanation (Waterfall): Generates adverse action reasoning for individual applicants, pinpointing the exact factors driving an applicant's risk score above the tolerance threshold.