Customer Uplift Modeling.
Application of causal meta-learners to estimate individual incremental promotion effects, eliminating wasted subsidies and maximizing campaign net profit.

Marketing Inefficiencies & Propensity Modeling Limits
Conventional marketing campaigns typically predict which customers are most likely to convert (propensity modeling) and offer blanket promotional discounts to those high-intent cohorts. This creates massive margin leakage: discounts are given to users who would have bought anyway (Sure Things), while users annoyed by frequent promotions (Sleeping Dogs) are pushed toward churn.
This project implements causal machine learning and uplift modeling to estimate the Individual Treatment Effect (ITE). By isolating the true incremental lift of promotions from baseline organic behavior, the system derives an optimal incentive policy that eliminates wasted subsidies and maximizes overall net campaign profit.
Causal Modeling Pipeline Architecture
The pipeline ingests randomized A/B promotion data and trains causal meta-learner architectures to map heterogeneous individual response:
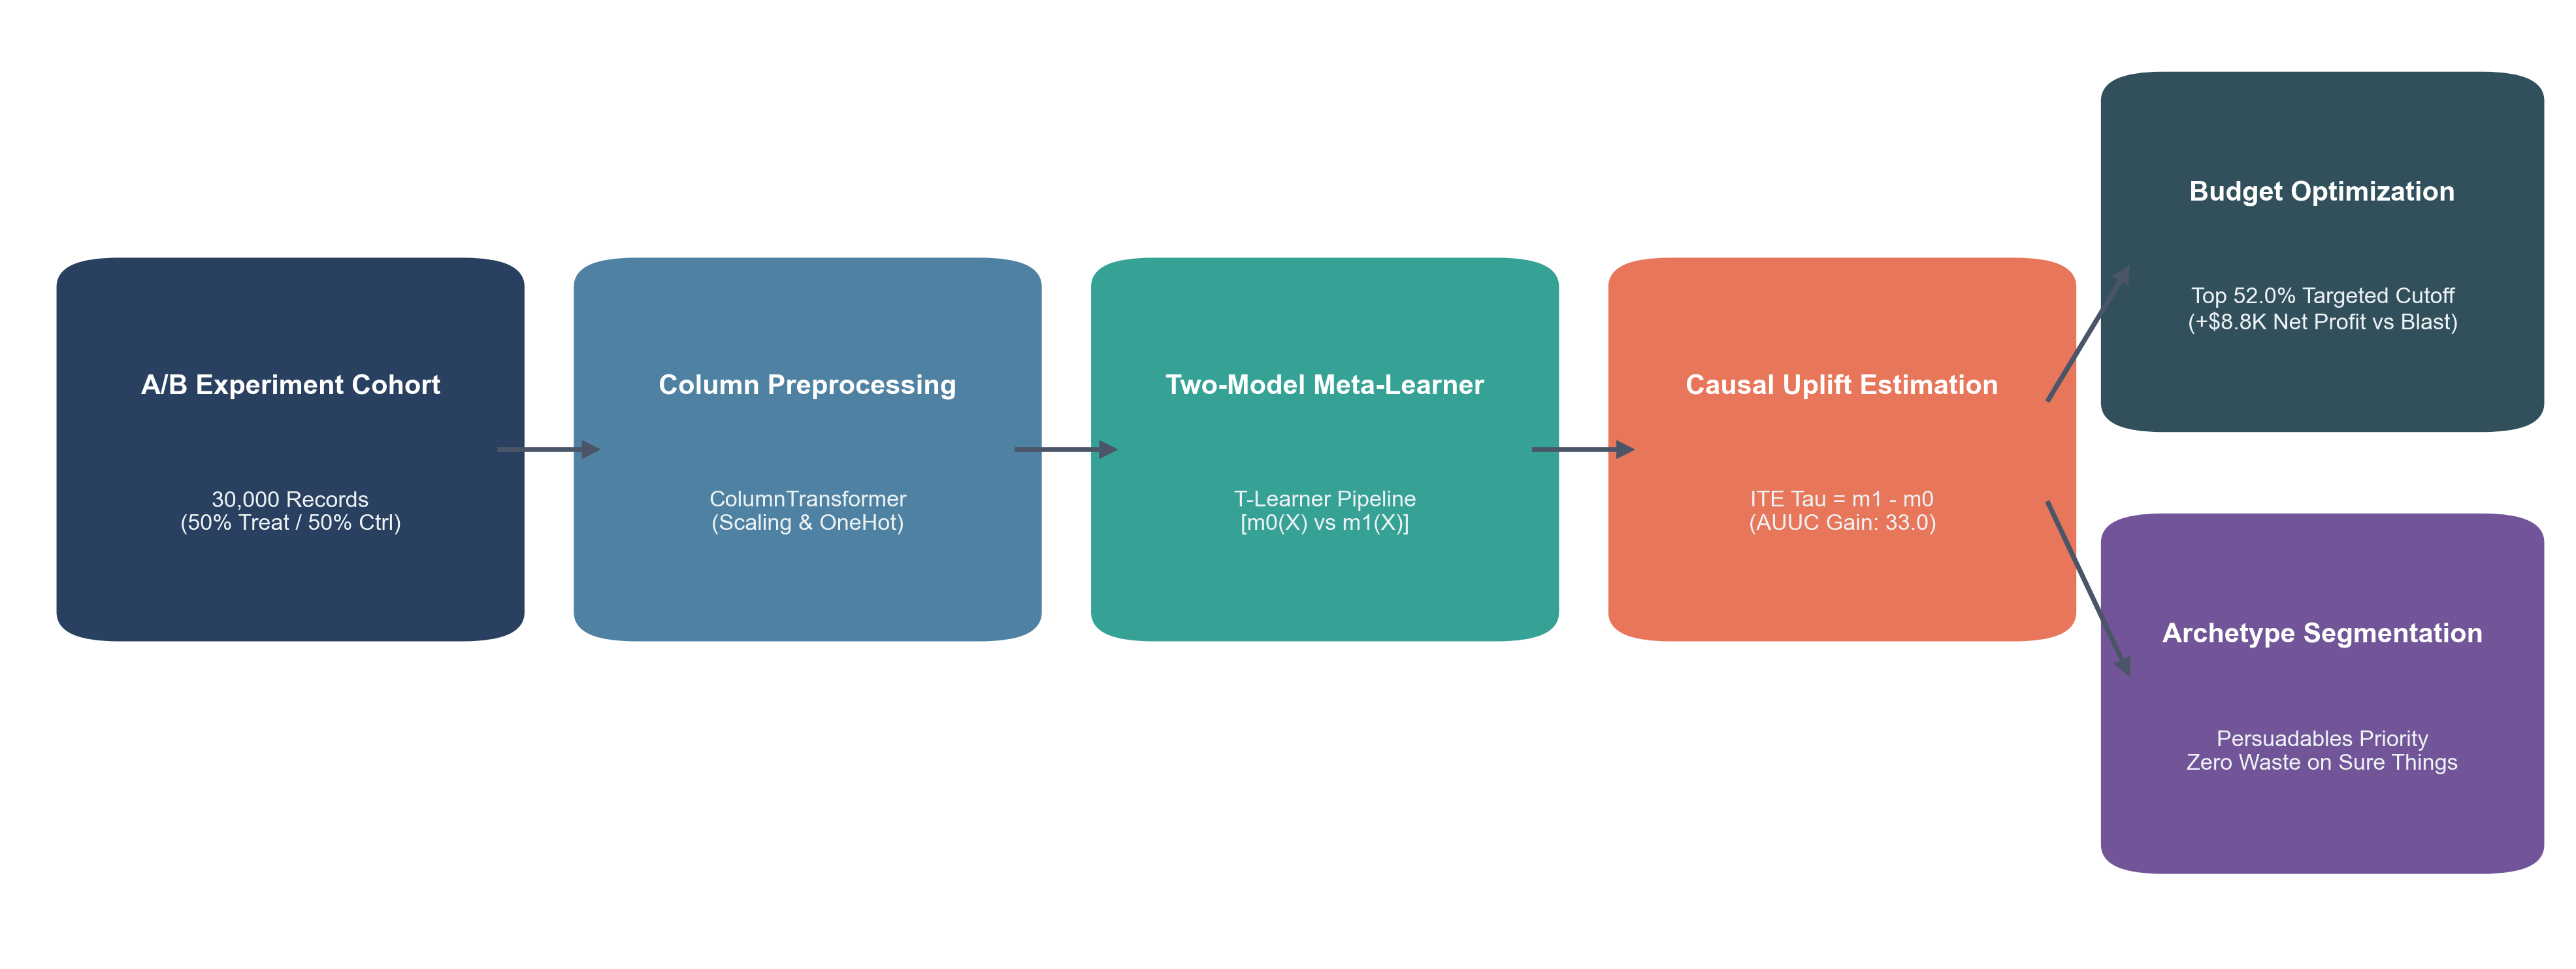
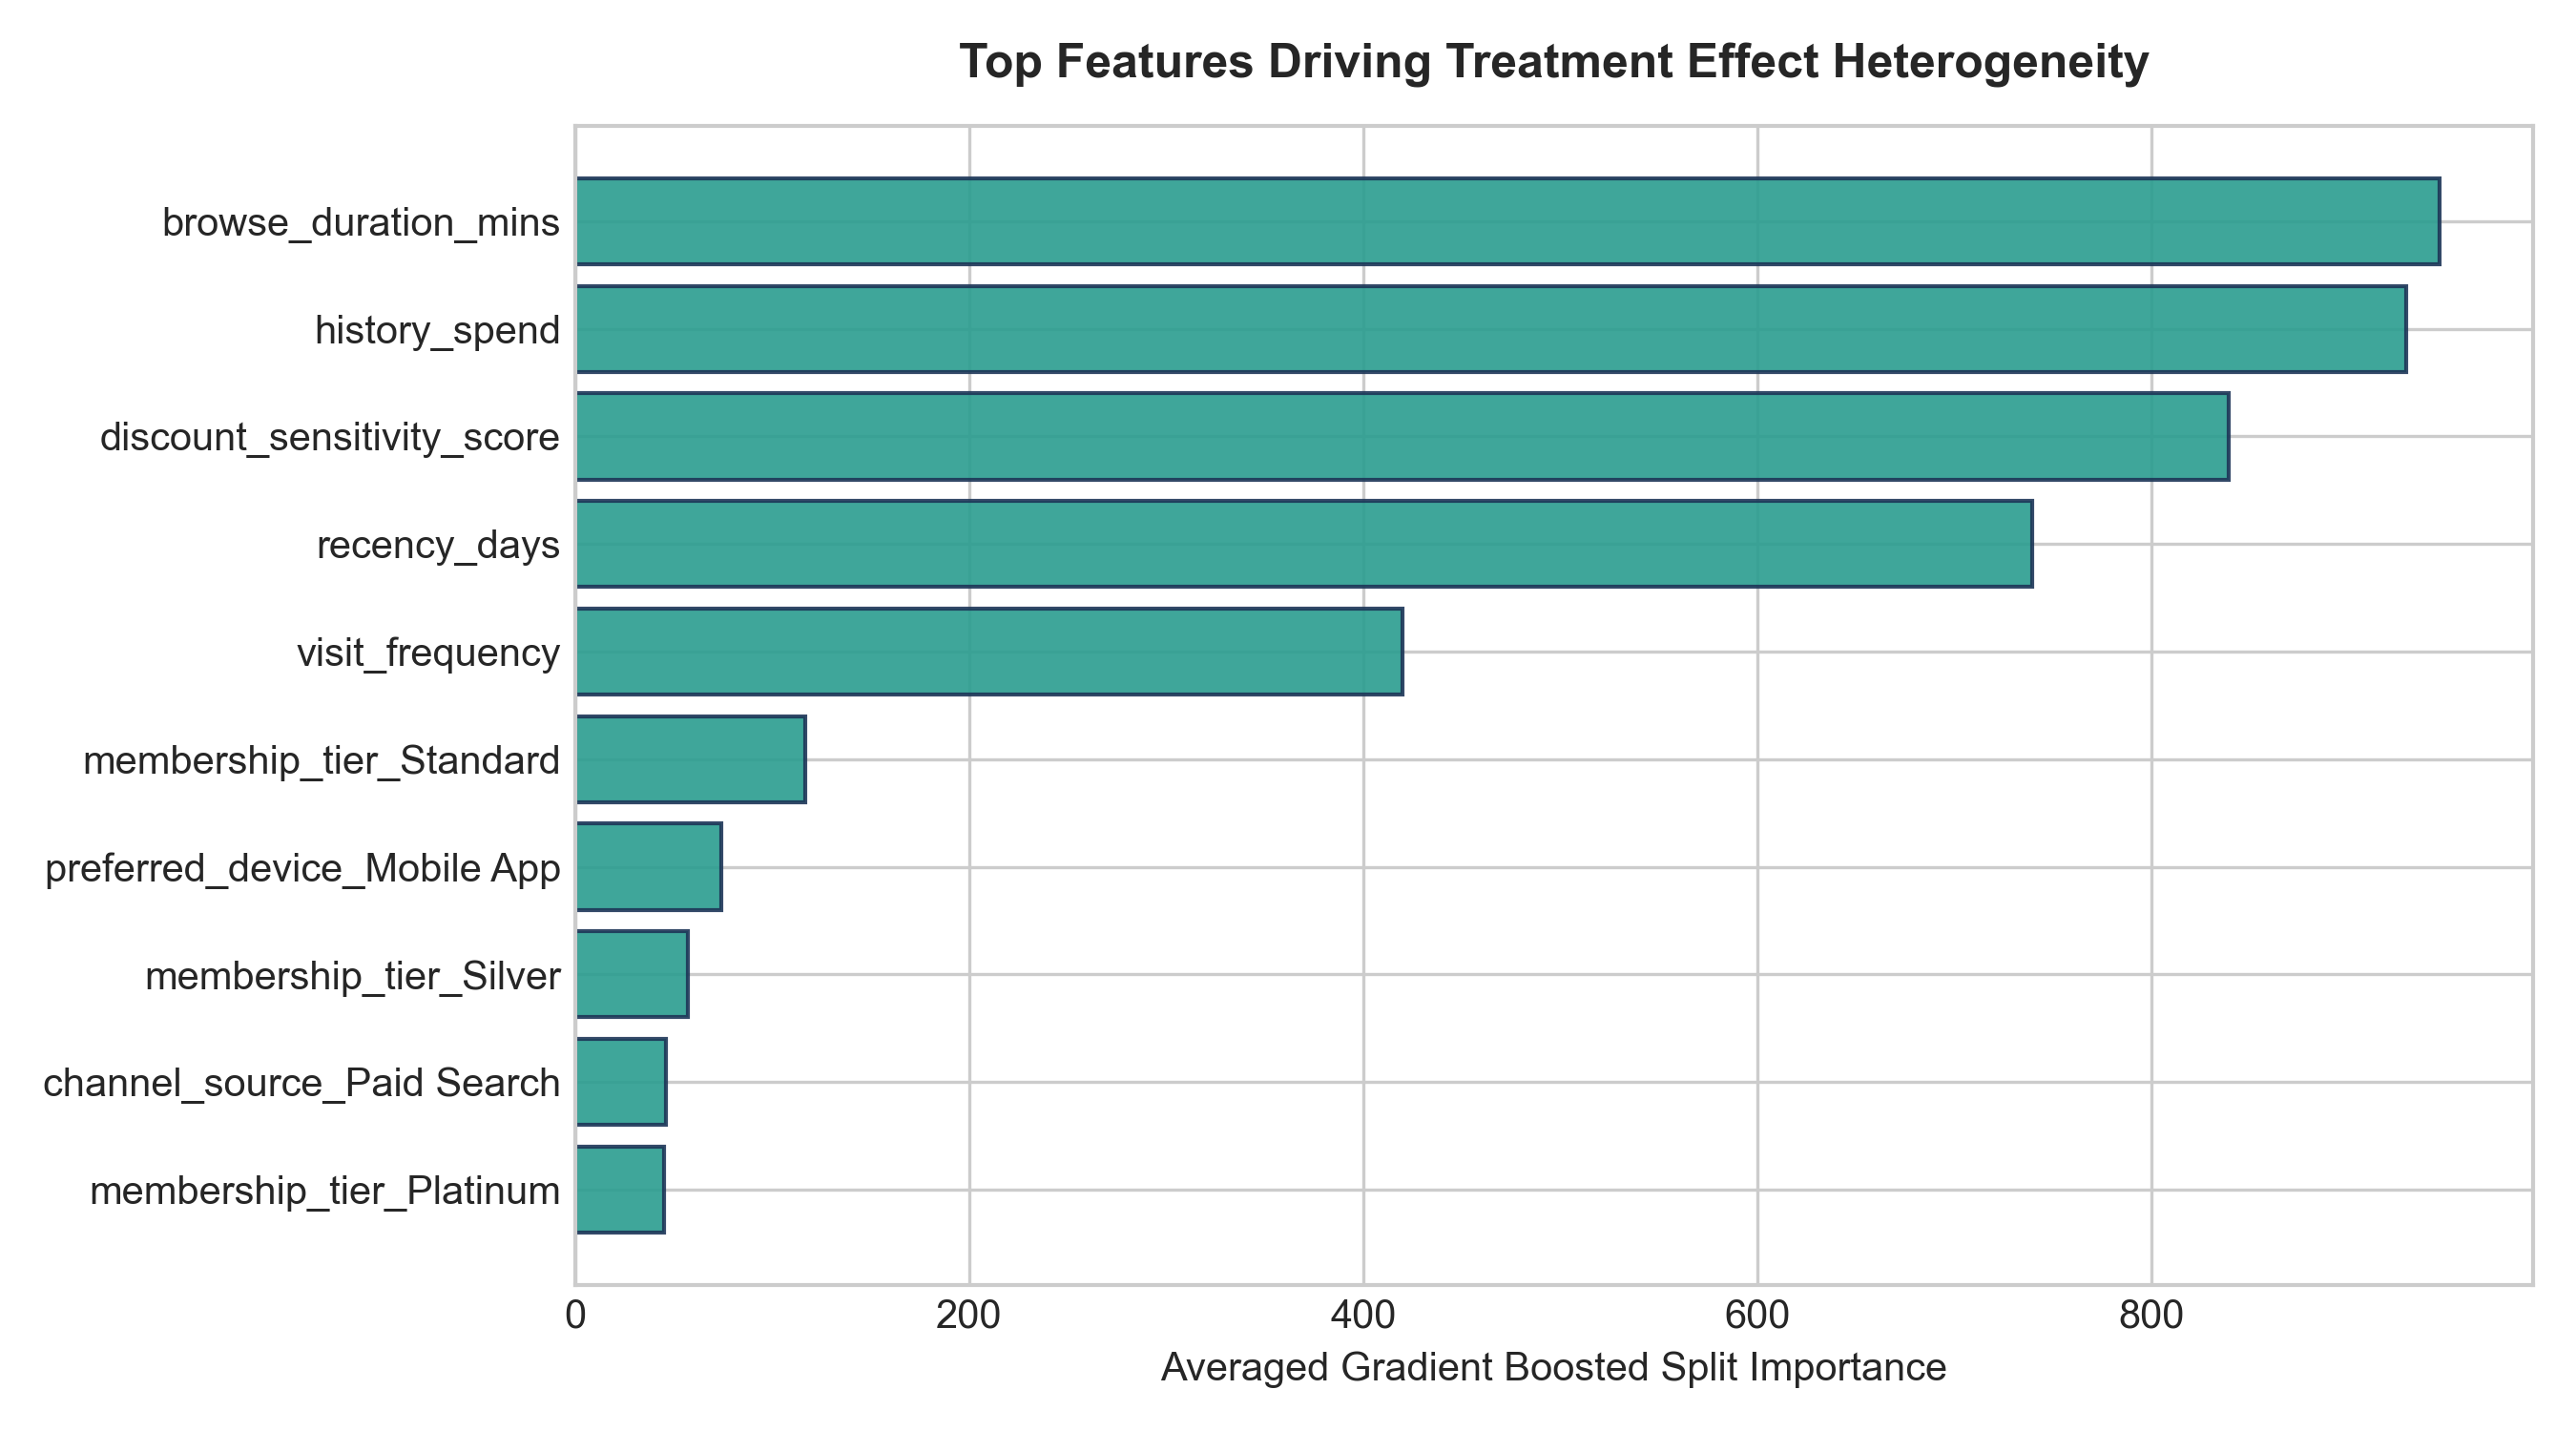
The pipeline extracts customer covariates, estimates price elasticity, evaluates Qini curves, and converts predicted uplift scores into optimal budget allocation cutoffs yielding peak ROI.
Customer Archetype Segmentation Matrix
Customers are mathematically categorized into four causal quadrants based on incremental conversion delta:
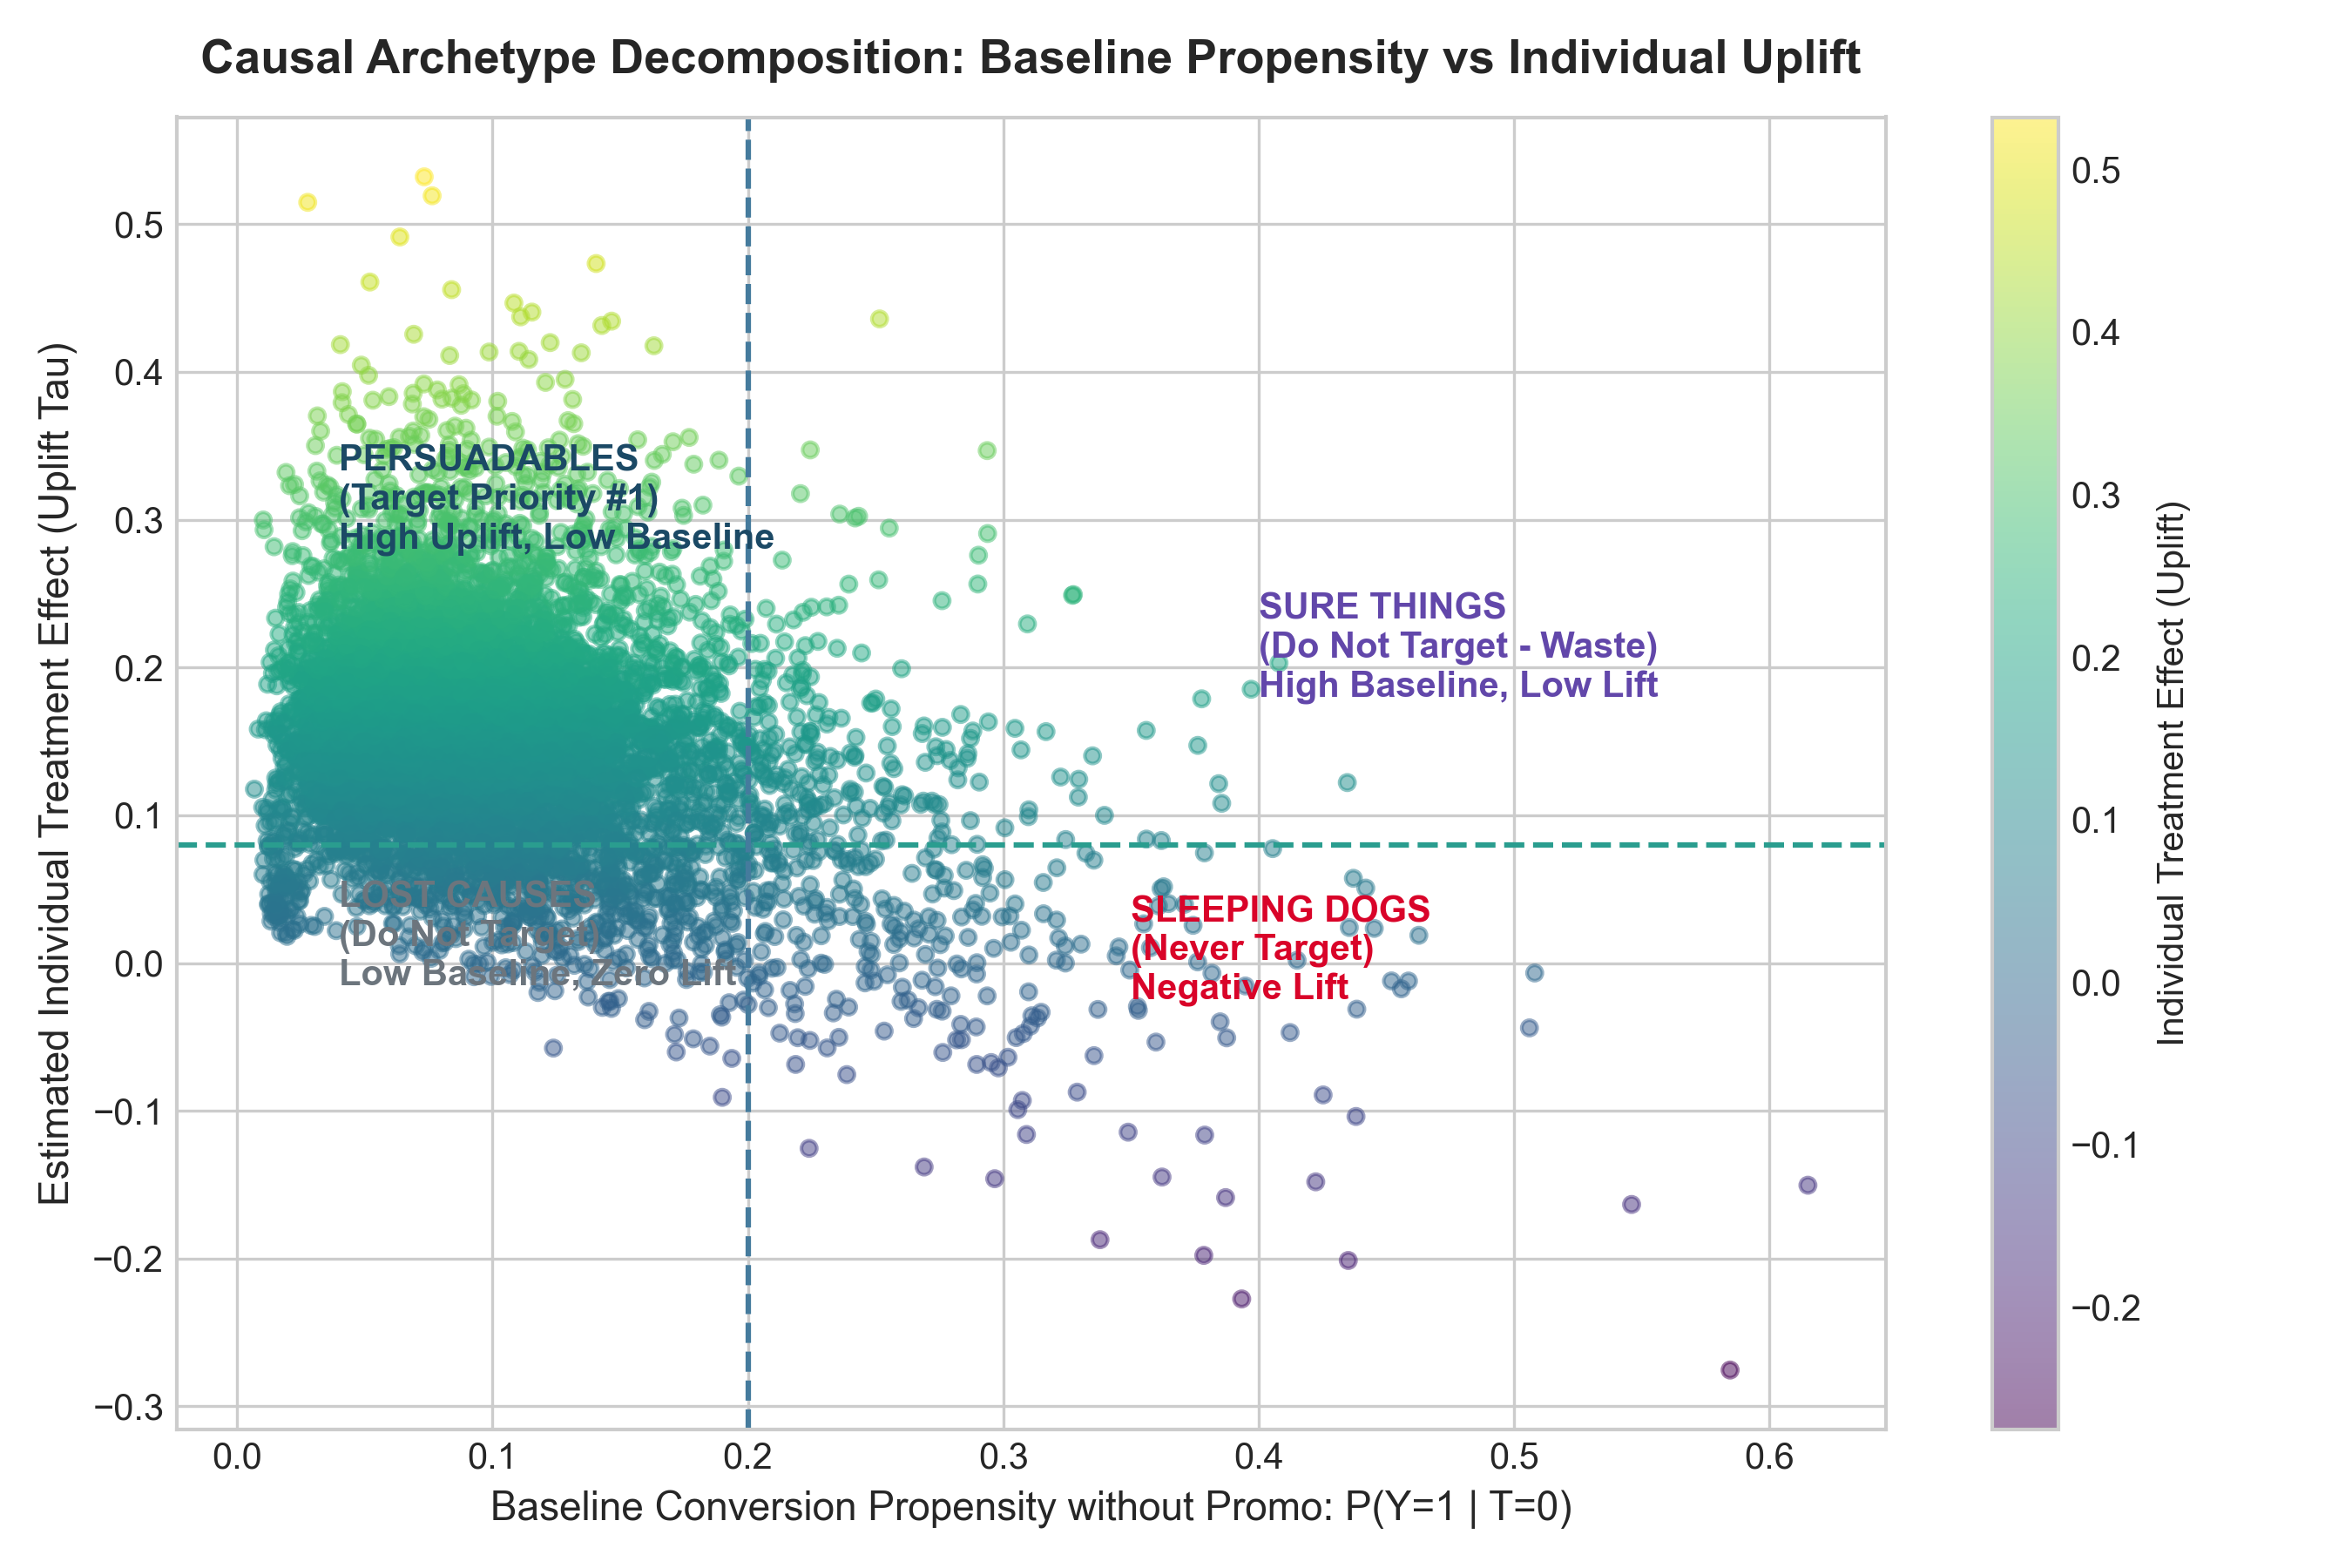
Only convert when given a promotional incentive. Every dollar of discount allocated here yields genuine incremental profit.
High organic purchase probability regardless of promotion. Offering discounts here wastes company margin unnecessarily.
Will not convert even with maximum promotional subsidies. Allocating budget to this cohort yields zero ROI.
React negatively to marketing touchpoints (e.g., unsubscribing or churning). The system strictly suppresses outreach to this segment.
Qini Curve Evaluation & Meta-Learner Performance
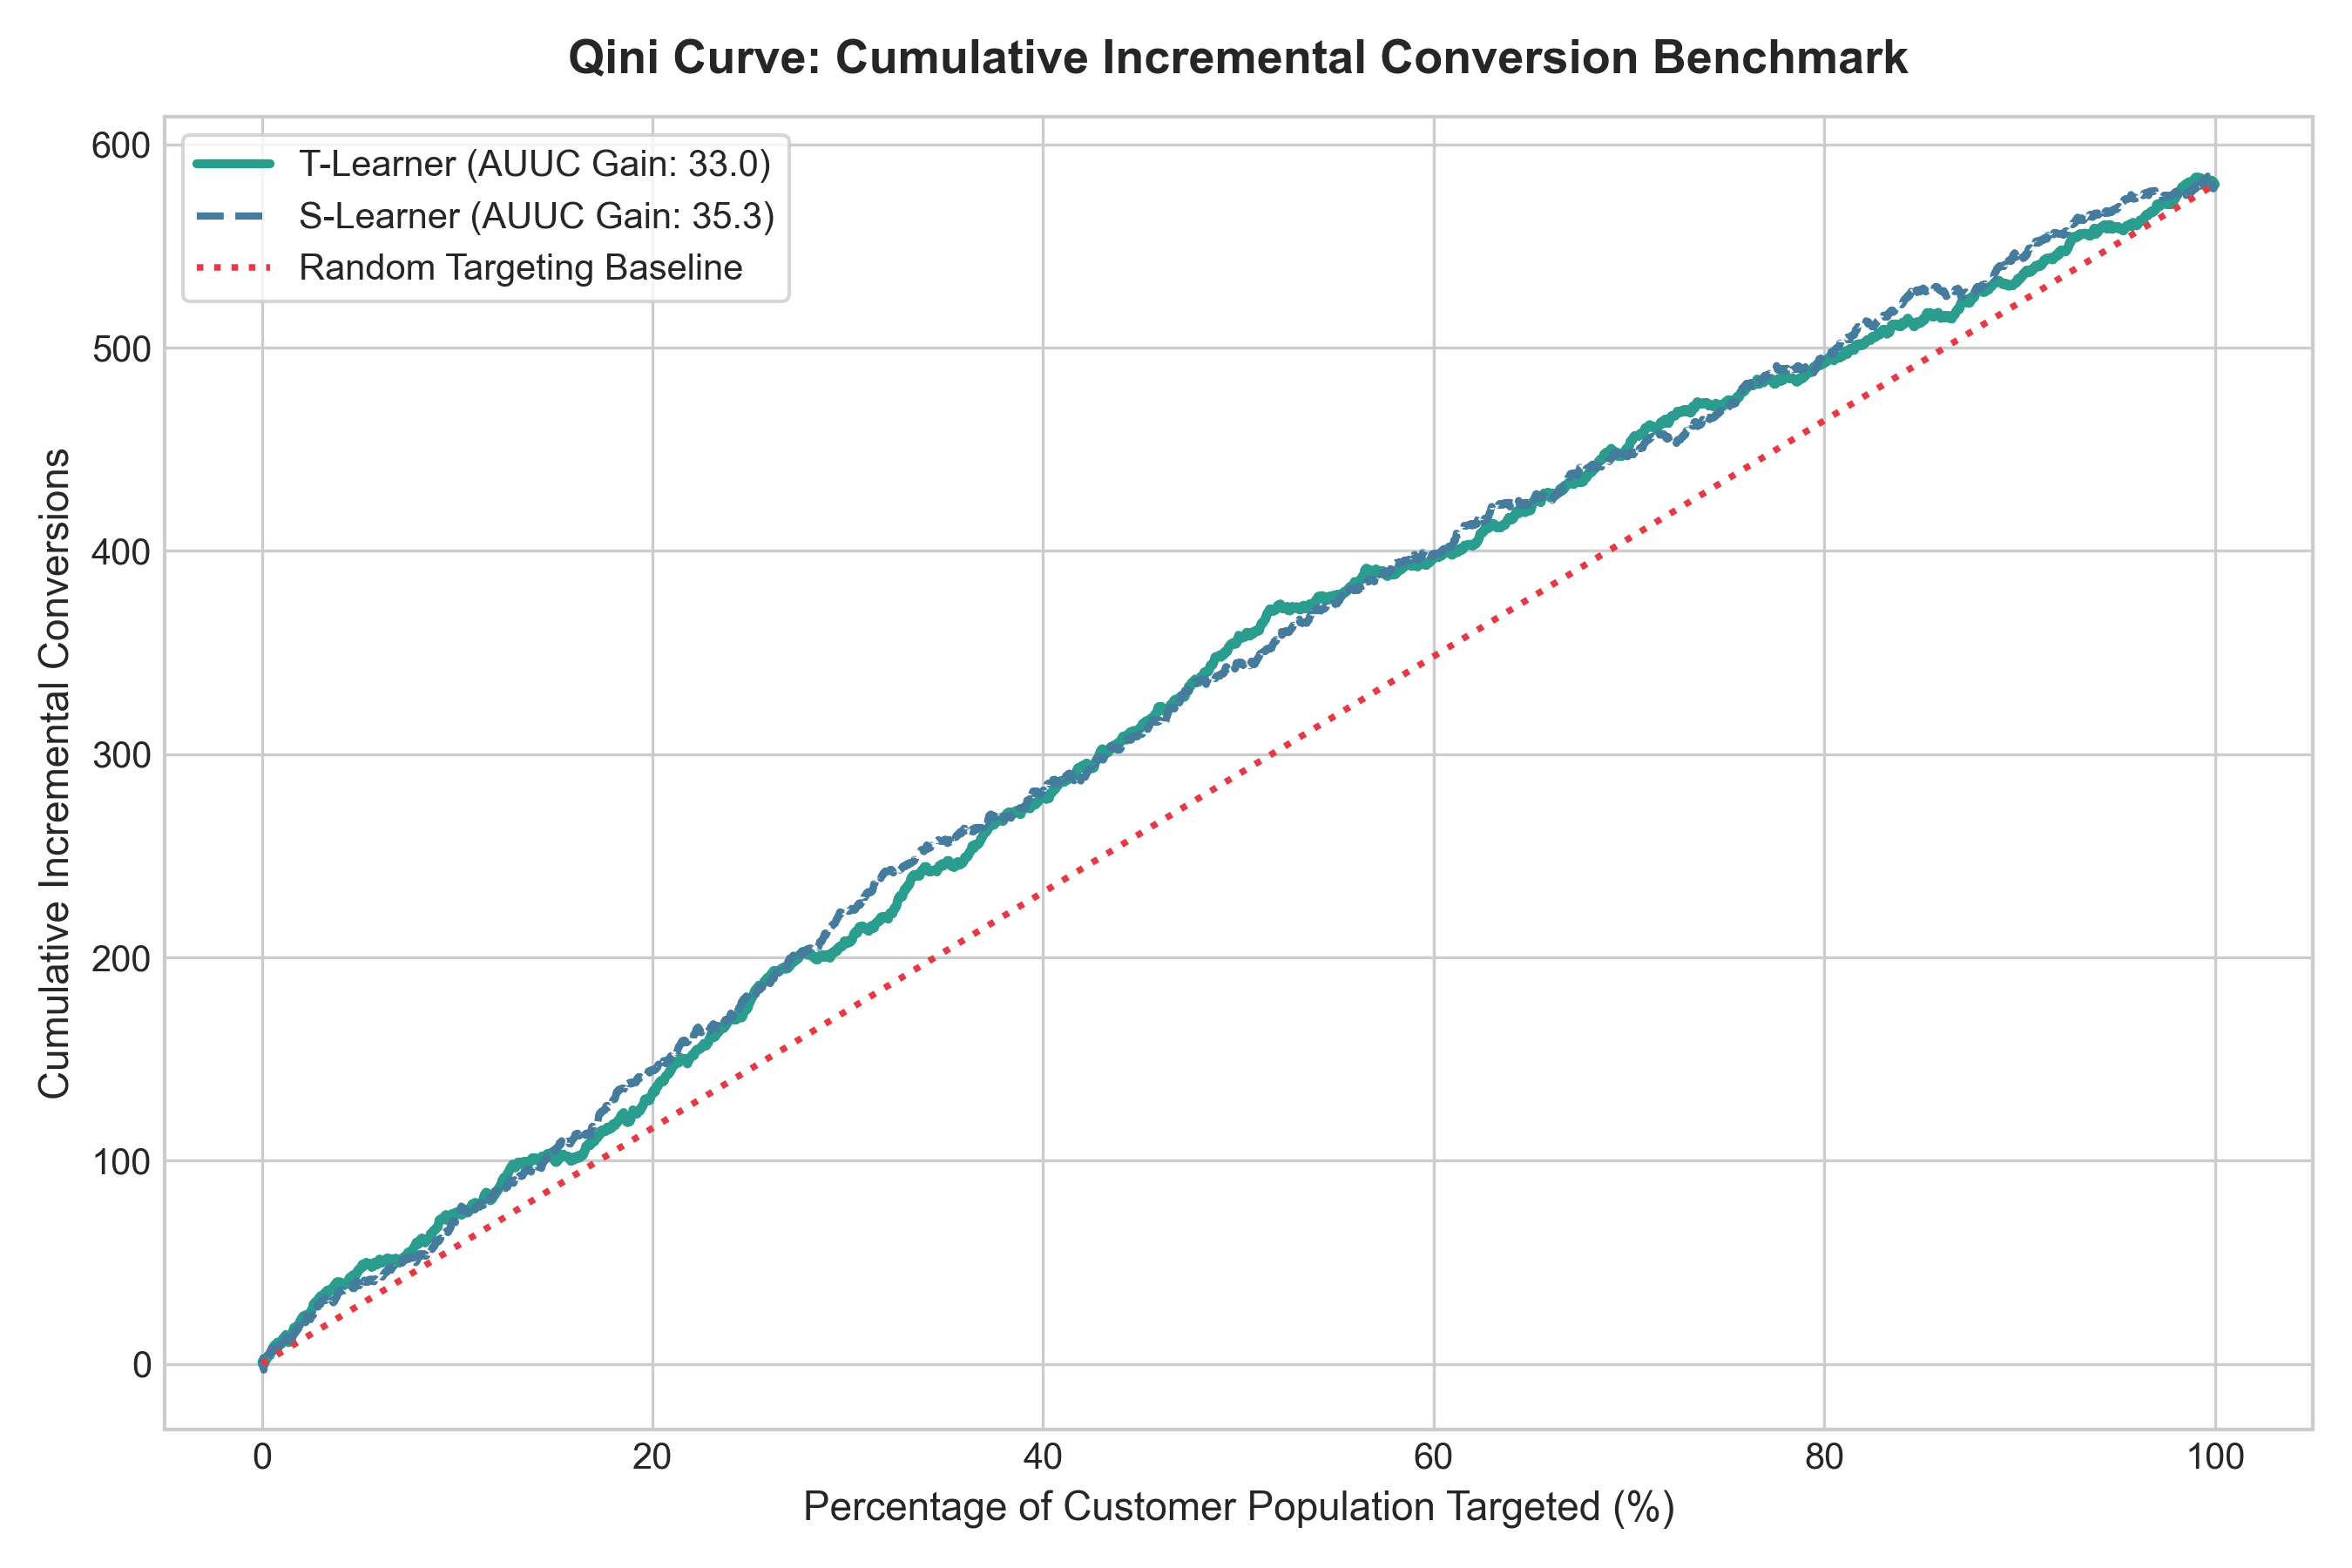
Standard accuracy metrics do not apply to causal modeling. Performance is evaluated using Area Under the Uplift Curve (AUUC) and Qini scores on held-out test data:
| Causal Architecture | Base Estimator | Qini Score (AUUC Gain) | Summary |
|---|---|---|---|
| Random Baseline | Uniform Random Assignment | 0.00 | Standard random campaign targeting without causal filtering |
| T-Learner Pipeline | Dual LightGBM Classifiers | 32.96 | Models control and treatment outcomes in independent models |
| S-Learner Architecture | Single LightGBM Classifier | 35.26 | Top performing model capturing covariate-treatment interactions |
Budget Optimization & Net Profit Curve (ROI Frontier)
In a realistic unit-economic simulation with a $40 product contribution margin and a $7 promotion cost per user:
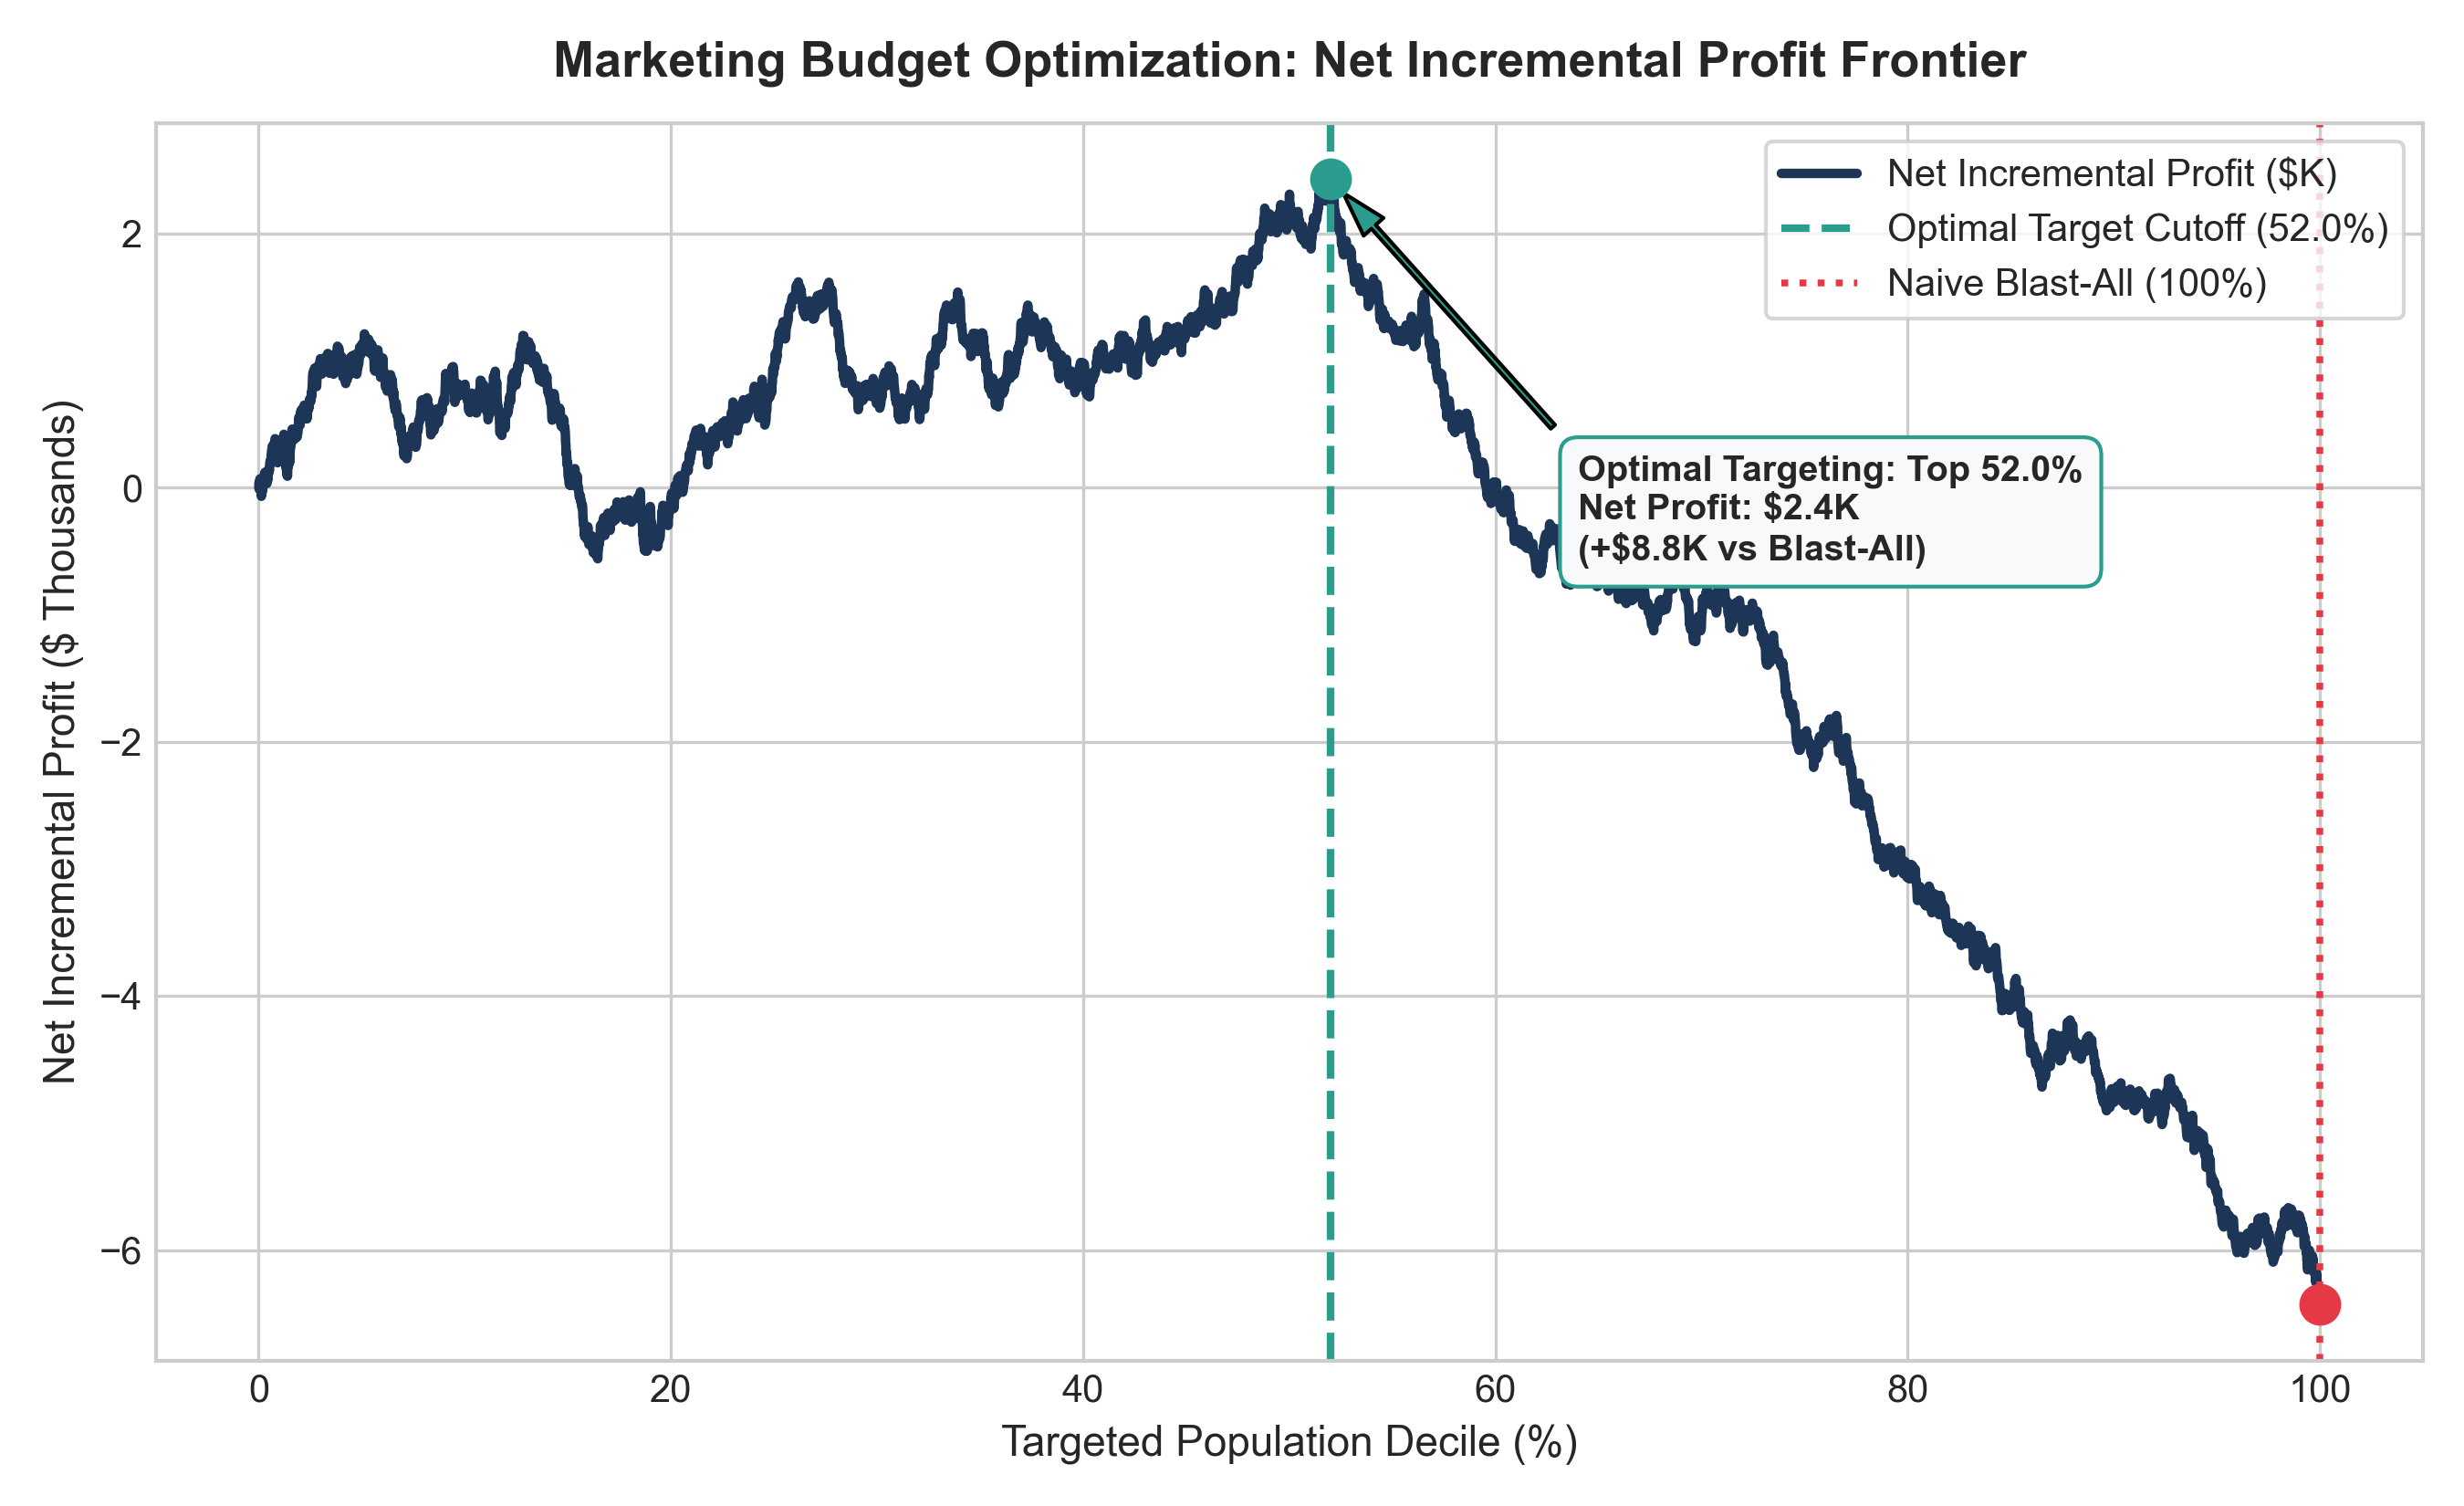
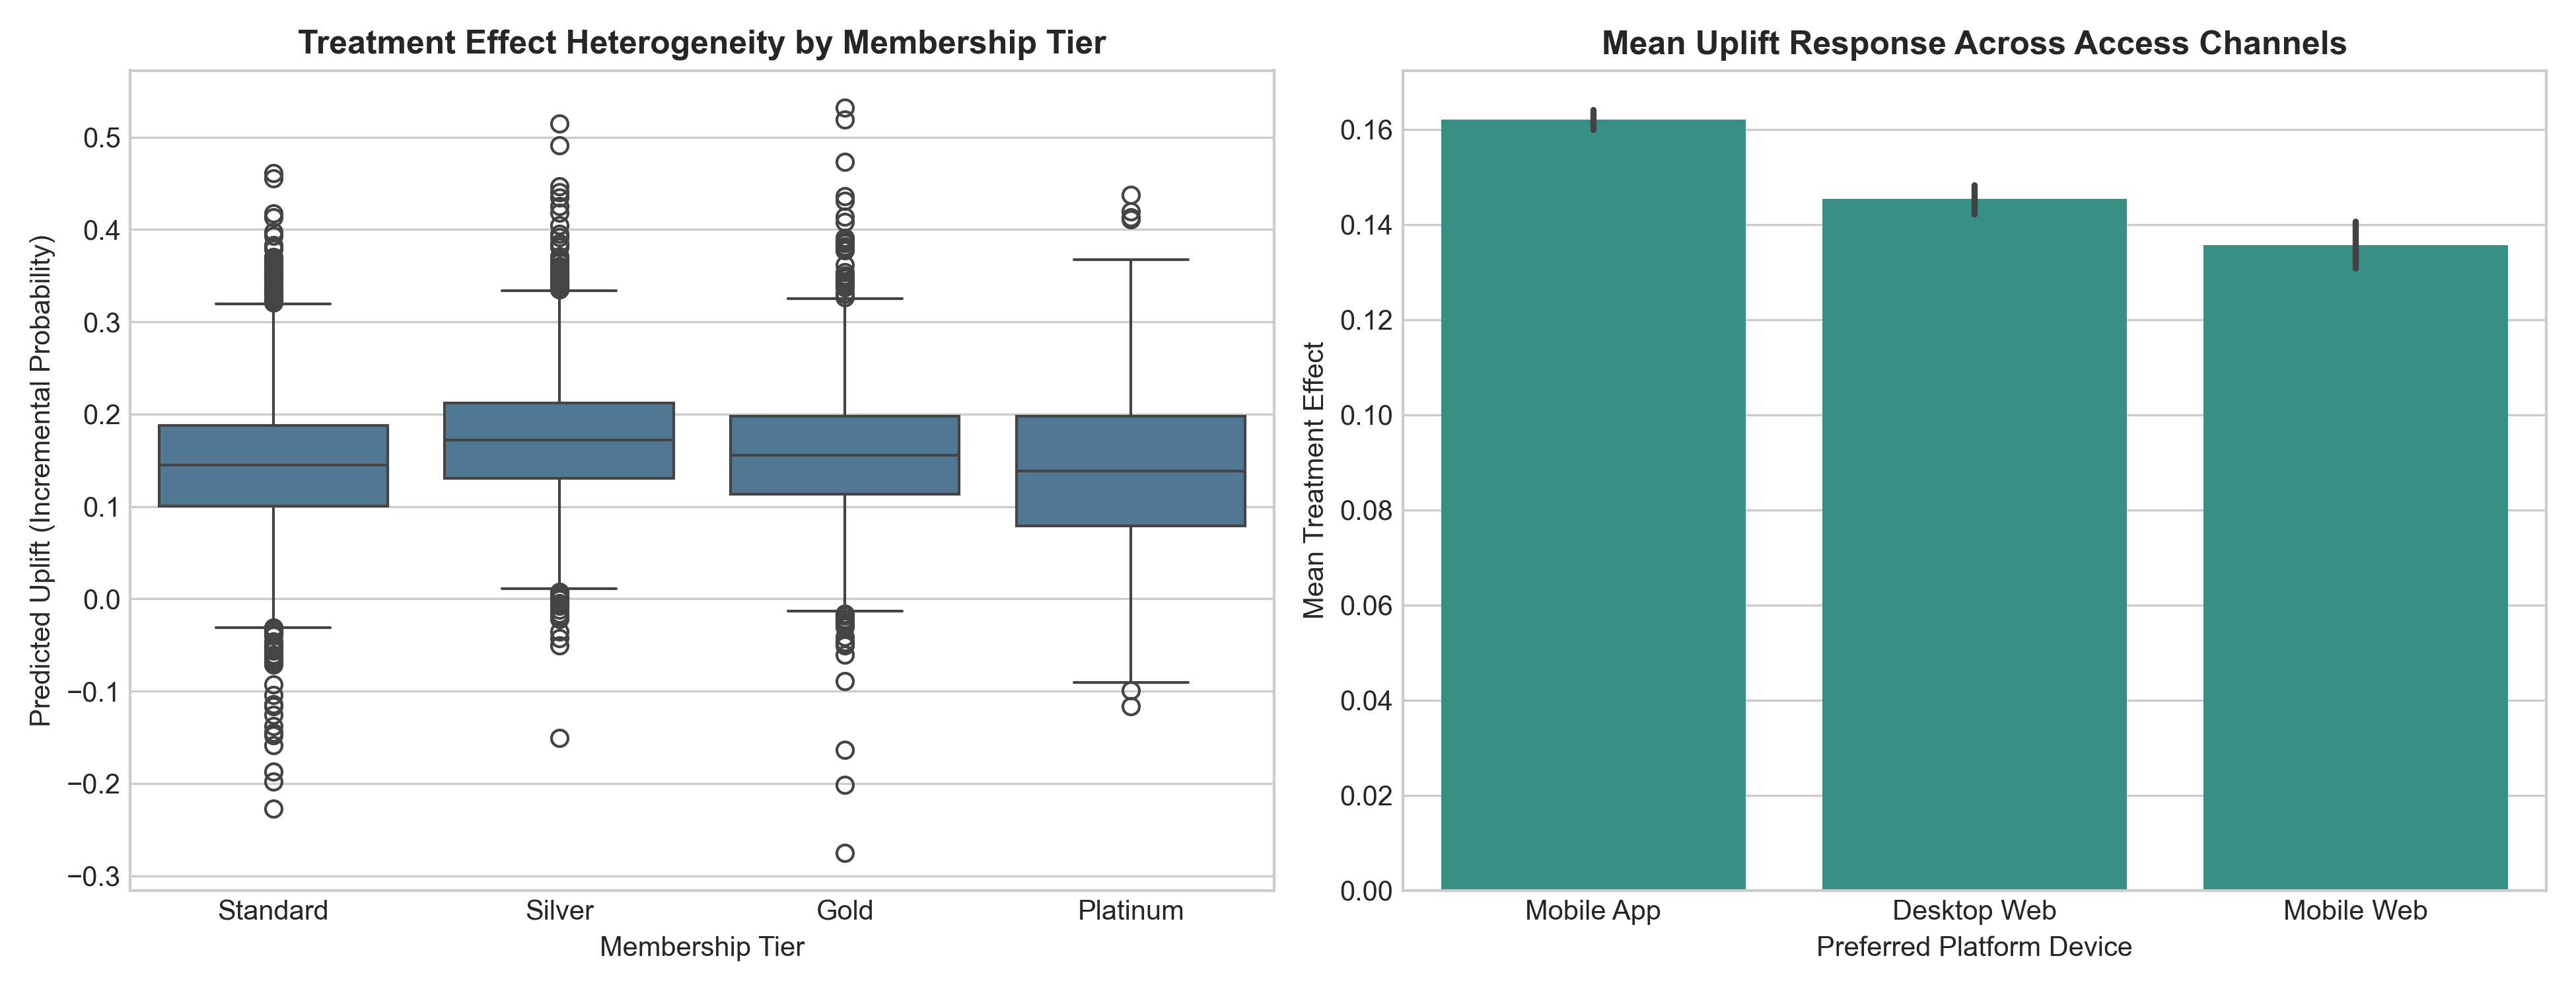
The model proves that peak net profit is achieved when promotions are targeted exclusively to the top 30% positive-uplift population. Targeting beyond 30% decreases total profit because subsidy costs outweigh the incremental revenue generated.