Energy Demand Forecasting.
An XGBoost-based time-series machine learning architecture predicting hourly electrical power consumption with a 2.78% mean absolute percentage error for regional transmission grid optimization.

Operational Challenges & Grid Context
Balancing power supply and demand across regional transmission grids requires high-precision load forecasting. Inaccurate load forecasts risk blackouts, wasteful fuel consumption from peaker plants, or sharp spikes in grid operational costs.
This project establishes a time-series forecasting architecture using gradient-boosted tree regression (XGBoost) to predict hourly power consumption in Megawatts (MW). The model forecasts electricity demand with a mean percentage error below 3% (MAPE 2.78%) and accounts for 90.73% of demand variance on unseen future data.
Chronological Data Splitting Free of Leakage
In time-series modeling, random train-test splitting is a fatal flaw that causes lookahead data leakage. This project applies strict temporal separation across 17,520 hourly observations:
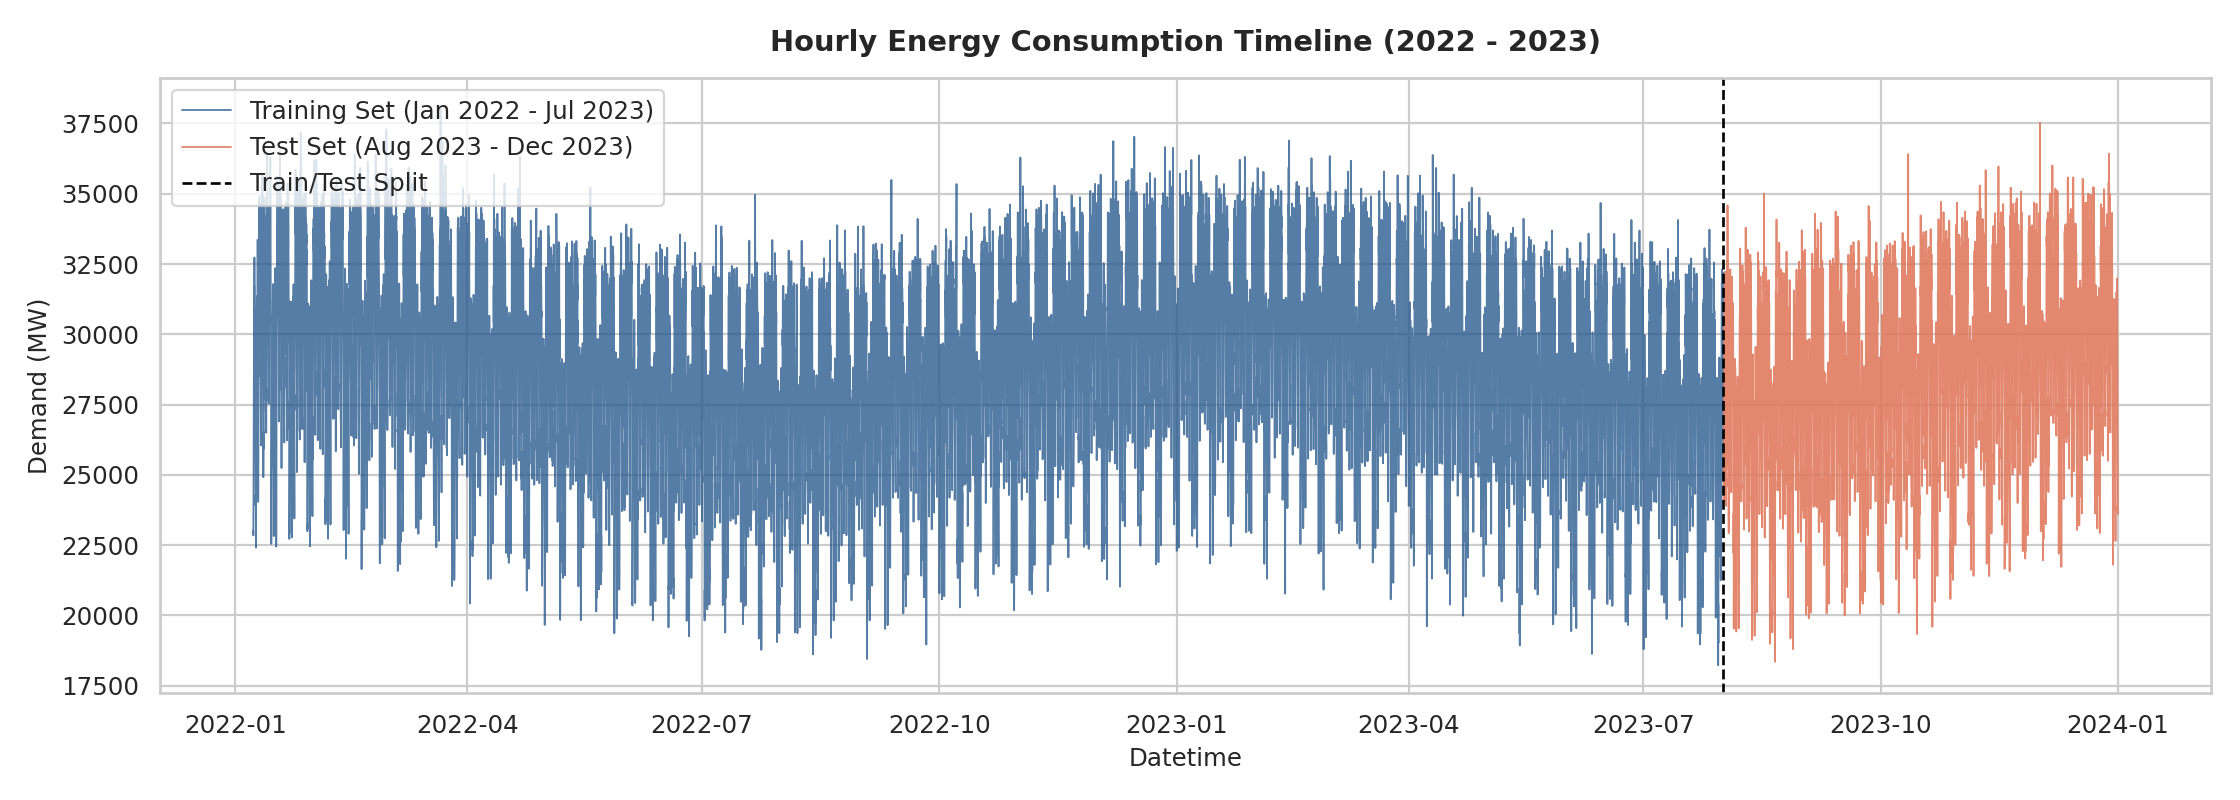
- Training Set: January 1, 2022 to July 31, 2023 (13,680 consecutive hourly observations).
- Out-of-Time Test Set: August 1, 2023 to December 31, 2023 (3,672 future hourly observations).
Seasonality Analysis & Load Fluctuations
Exploratory analysis identifies three dominant periodic cycles governing grid load:
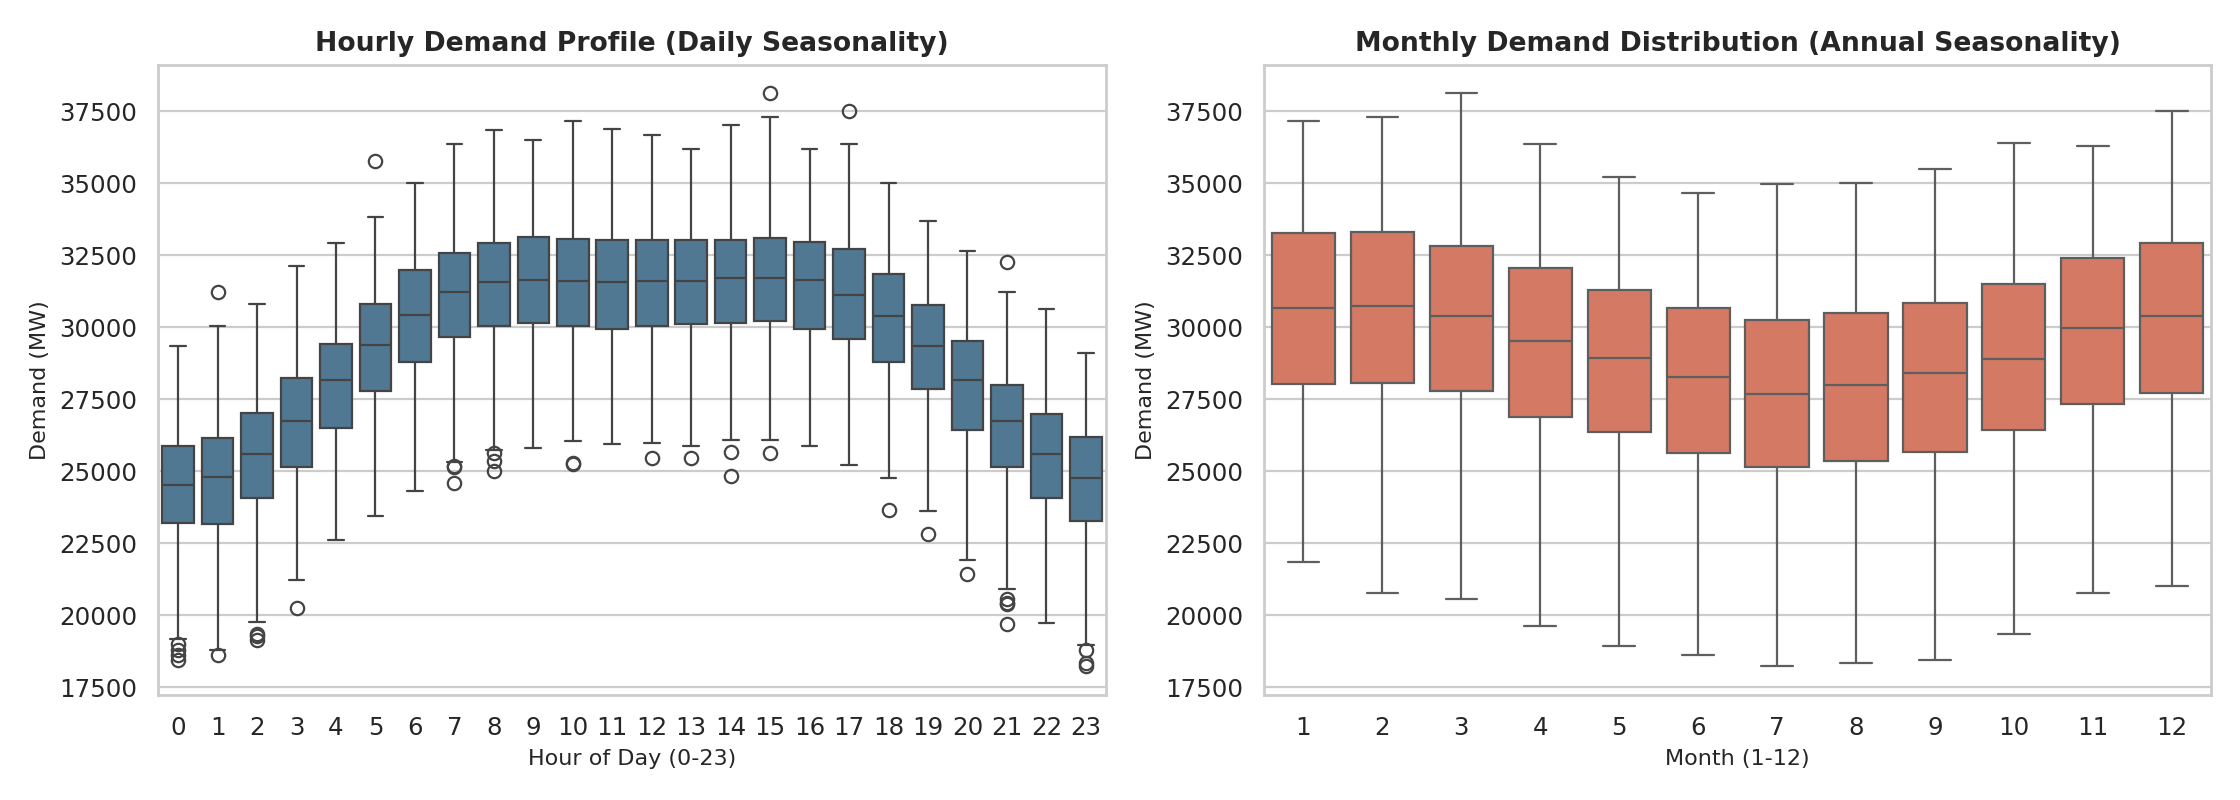
Peak demand occurs at 14:00 (commercial cooling) and 19:00 (residential evening peak), reaching a trough at 04:00 early morning.
Weekdays consistently exceed weekends by an average margin of 3,500 MW driven by industrial facilities and offices.
Extreme seasonal surges occur in July and August (summer cooling) and January and February (winter heating).
Feature Engineering & Predictor Importance
Twelve temporal predictors were engineered to capture time-series autocorrelation without future leakage:
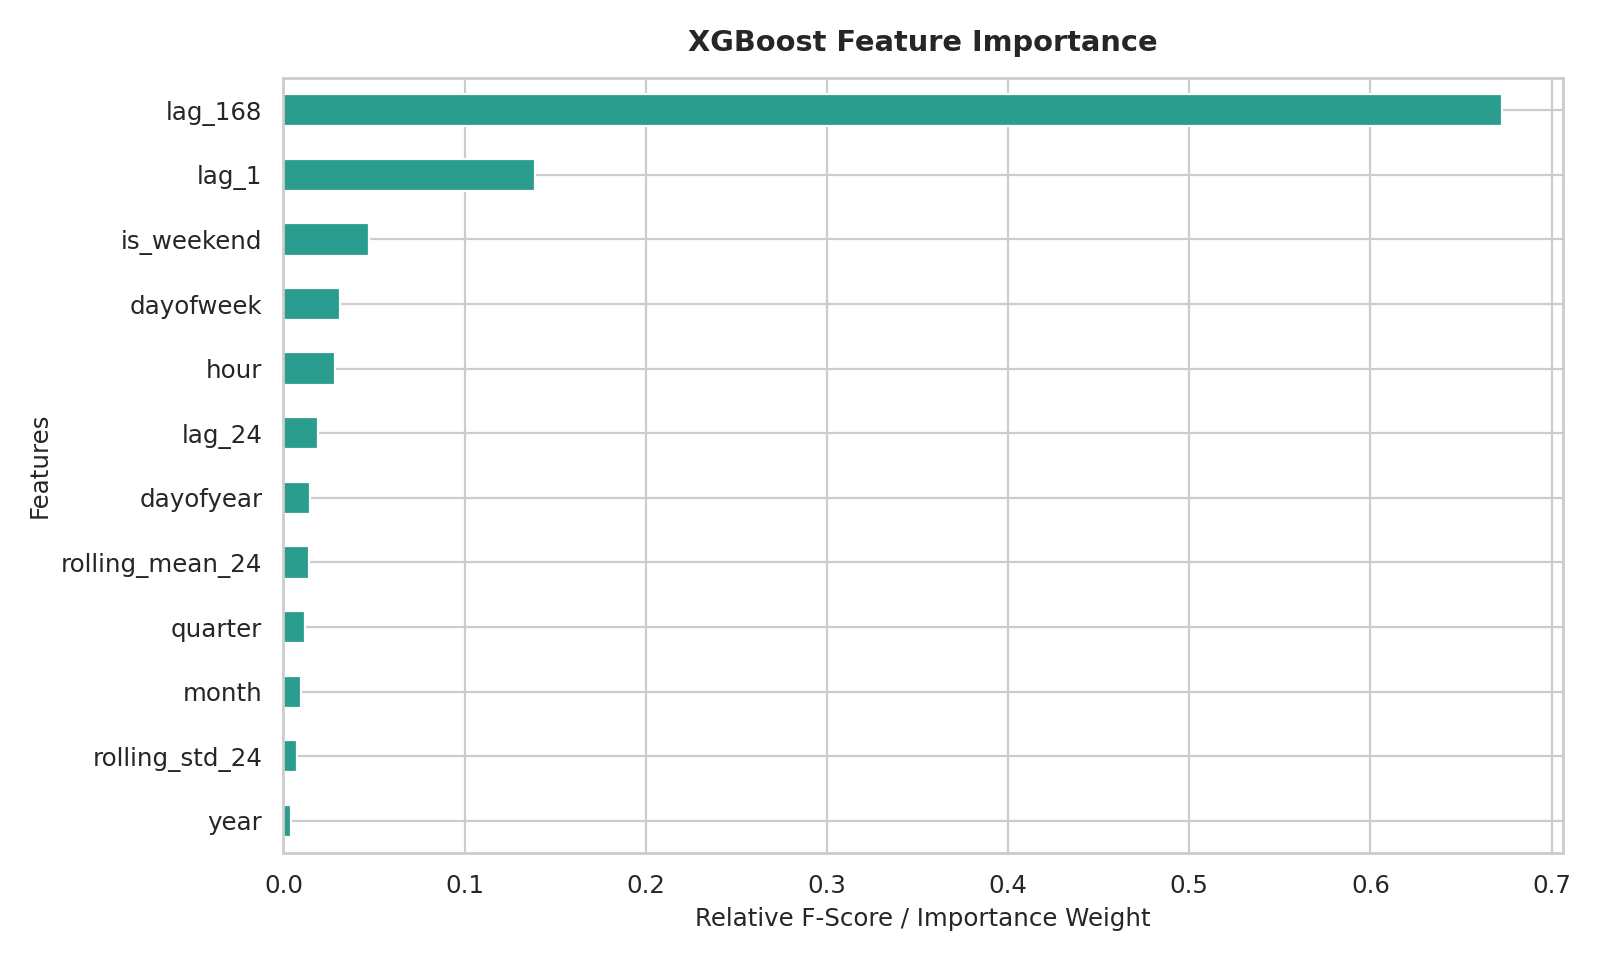
- Dominant Predictors: The 1-hour prior lag (
lag_1) and 24-hour prior lag (lag_24) deliver the highest F-score weighting in the tree model. - Rolling Window Dynamics: 24-hour moving averages (
rolling_mean_24) capture shifting daily baselines. - Calendar & Day Types: Hour indicators (
hour), day of week (dayofweek), and weekend flags (is_weekend).
Model Evaluation Results & Residual Diagnostics
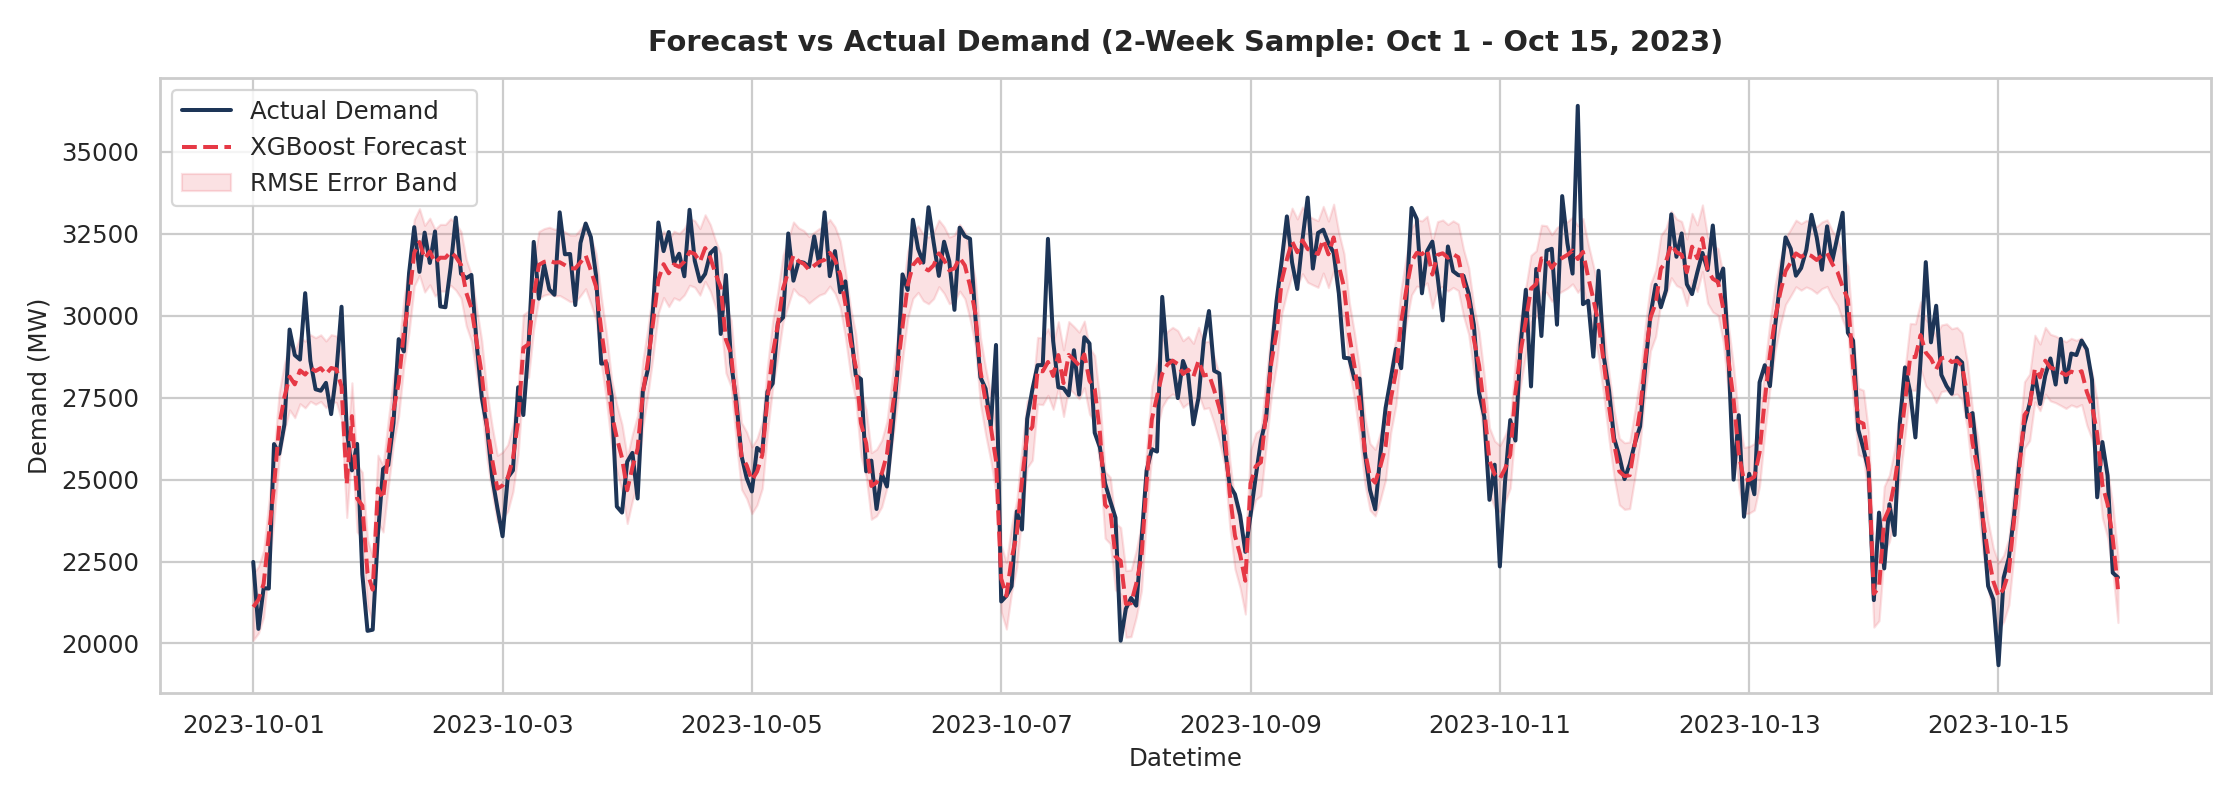
Evaluating the tuned XGBoost model across 3,672 out-of-time future hours yields precise forecast alignment with actual grid demand:
| Evaluation Metric | Model Score | Operational Significance |
|---|---|---|
| MAPE | 2.78% | Exceptional percentage accuracy, well exceeding the 5% industry standard |
| RMSE | 956.92 MW | Absolute prediction error remains tightly bounded within normal operational reserve margins |
| R² Score | 0.9073 | Model explains 90.73% of electricity consumption variance on unseen data |
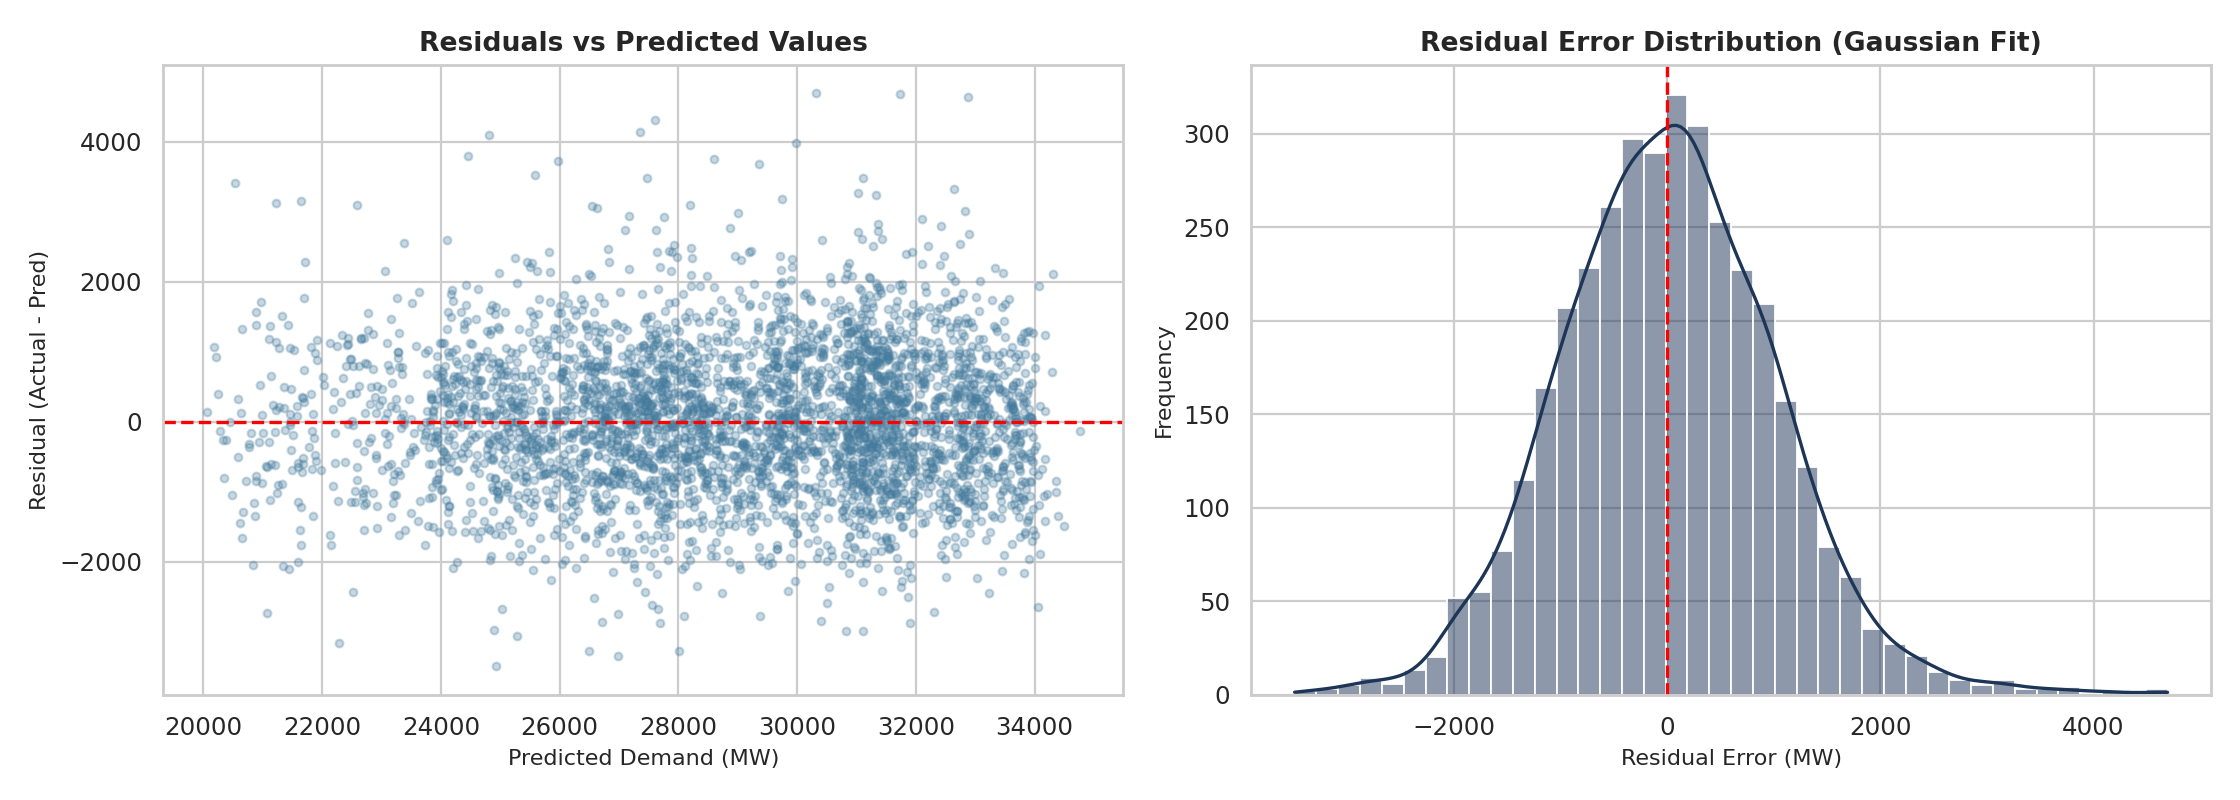
Residual analysis confirms errors are normally distributed around zero without systematic bias, verifying reliability for day-ahead generation planning.